Asian stocks are expected to remain cautionary as global growth has encountered a downward revision. (Pivot Orderbook analysis)
…
This is a premium post.
[s2If !current_user_can(access_s2member_level4)]Please register for PREMIUM VERSION HERE to read full post below containing analysis. In case of any error or you think you are not able to read the full post below, please email us at support#nehcap.com [lwa][/s2If] [s2If current_user_can(access_s2member_level4)]
- Asian stocks are expected to remain cautionary as global growth has encountered a downward revision.
- Global markets are likely to remain on tenterhooks ahead of the US GDP release.
- Oil price has dropped below $80.50 as the US recession fears are still solid.
The pair currently trades last at 27436.49.
The previous day high was 27460.12 while the previous day low was 27199.76. The daily 38.2% Fib levels comes at 27360.66, expected to provide support. Similarly, the daily 61.8% fib level is at 27299.22, expected to provide support.
Markets in the Asian domain are showing signs of caution amid the release of corporate earnings worldwide and ahead of the United States Gross Domestic Product (GDP) data. The US Dollar Index (DXY) is gauging a cushion around seven-month low at 101.10, however, the downside bias is extremely solid. S&P500 futures are displaying modest gains recorded in early Asia after settling Wednesday’s trading session on a flat note. The risk profile is positive, however, anxiety among investors will remain high ahead of the US GDP and other economic data.
At the press time, Japan’s Nikkei225 eased 0.20%, KOSPI gained 0.70%, Hang Seng soared 1.75%, Chinese markets are closed on account of the Lunar New Year while Indian markets are closed due to Republic Day.
A poll conducted by Reuters on global growth indicates that the global economy will grow by 2.1% in 2023; 2.8% in 2024 vs. 2.3% and 3.0%, respectively, in an October poll. Reuters stated that ‘Falling energy prices, a slowdown in inflation in most economies from multi-decade highs, an unexpectedly resilient euro zone economy and China’s economic reopening have led traders to speculate the downturn will be milder.”
Japanese equities are facing caution despite the Bank of Japan (BoJ) Governor Haruhiko Kuroda favored of a continuation of expansionary monetary policy. BoJ Kuroda has confirmed that the central bank “will resolutely keep the monetary environment easy.” He added that “the BoJ aims to regain market functionality by tweaking yield curve control operations while maintaining an easy monetary environment.
On the oil front, oil prices have surrendered the $80.50 support as the US recession is still in the picture despite rising bets for a smaller interest rate hike by the Federal Reserve (Fed). The Fed could not achieve price stability without entering into recession as retail demand needed to get squeezed and producers would be needed to drop output prices to maintain the harmony.
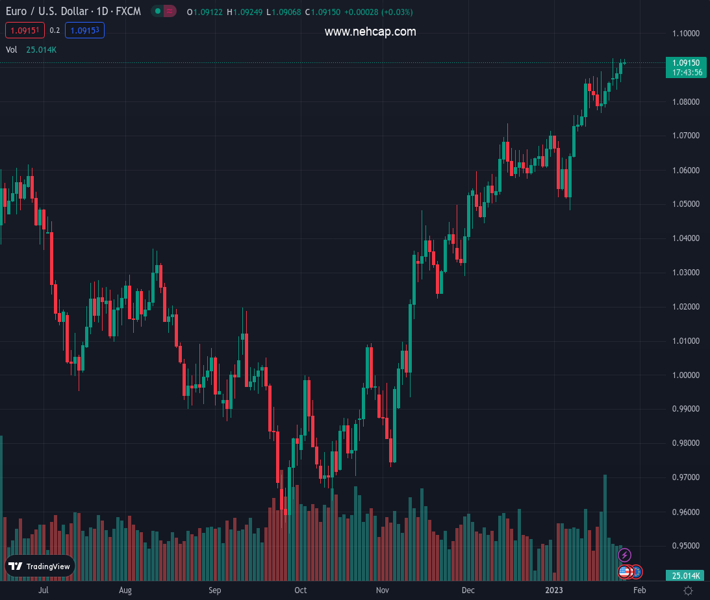
Technical Levels: Supports and Resistances
EURUSD currently trading at 27436.49 at the time of writing. Pair opened at 27436.49 and is trading with a change of 0.0 % .
| Overview | Overview.1 | |
|---|---|---|
| 0 | Today last price | 27436.49 |
| 1 | Today Daily Change | 0.00 |
| 2 | Today Daily Change % | 0.00 |
| 3 | Today daily open | 27436.49 |
The pair remains strongly bullish on the daily timeframe. It trades above its 20 SMA @ 26338.34, 50 SMA 27070.29, 100 SMA @ 27194.16 and 200 SMA @ 27211.99.
| Trends | Trends.1 | |
|---|---|---|
| 0 | Daily SMA20 | 26338.34 |
| 1 | Daily SMA50 | 27070.29 |
| 2 | Daily SMA100 | 27194.16 |
| 3 | Daily SMA200 | 27211.99 |
The previous day high was 27460.12 while the previous day low was 27199.76. The daily 38.2% Fib levels comes at 27360.66, expected to provide support. Similarly, the daily 61.8% fib level is at 27299.22, expected to provide support.
Note the levels of interest below:
- Pivot support is noted at 27270.79, 27105.1, 27010.43
- Pivot resistance is noted at 27531.15, 27625.82, 27791.51
| Levels | Levels.1 |
|---|---|
| Previous Daily High | 27460.12 |
| Previous Daily Low | 27199.76 |
| Previous Weekly High | 26965.10 |
| Previous Weekly Low | 25812.13 |
| Previous Monthly High | 28325.89 |
| Previous Monthly Low | 25793.22 |
| Daily Fibonacci 38.2% | 27360.66 |
| Daily Fibonacci 61.8% | 27299.22 |
| Daily Pivot Point S1 | 27270.79 |
| Daily Pivot Point S2 | 27105.10 |
| Daily Pivot Point S3 | 27010.43 |
| Daily Pivot Point R1 | 27531.15 |
| Daily Pivot Point R2 | 27625.82 |
| Daily Pivot Point R3 | 27791.51 |
[/s2If]
Join Our Telegram Group
")


