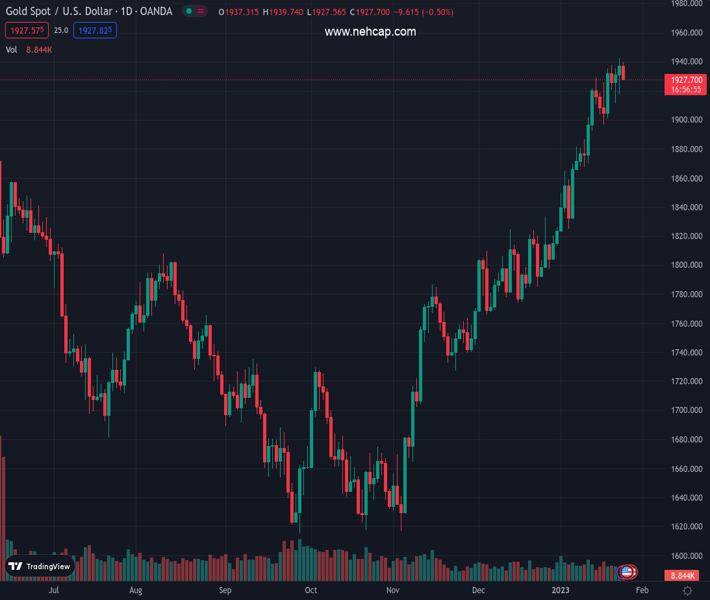
#XAUUSD @ 1,927.75 Gold Price pares weekly gains with mild losses as it snaps two-day uptrend., @nehcap view: Pullback expected (Pivot Orderbook analysis)
…
This is a premium post.
[s2If !current_user_can(access_s2member_level4)]Please register for PREMIUM VERSION HERE to read full post below containing analysis. In case of any error or you think you are not able to read the full post below, please email us at support#nehcap.com [lwa][/s2If] [s2If current_user_can(access_s2member_level4)]
- Gold Price pares weekly gains with mild losses as it snaps two-day uptrend.
- Global markets remain sidelined amid pre-GDP anxiety, mixed concerns surrounding Fed.
- Light calendar, off in China add to the market’s inaction and probe XAU/USD traders.
The pair currently trades last at 1927.75.
The previous day high was 1942.57 while the previous day low was 1917.19. The daily 38.2% Fib levels comes at 1932.87, expected to provide resistance. Similarly, the daily 61.8% fib level is at 1926.89, expected to provide support.
Gold price (XAU/USD) prints mild losses around $1,930 as it consolidates the gains marked during the last six consecutive weeks. That said, sluggish markets on early Wednesday join the cautious mood ahead of the key US data/events, as well as technical formation, to tease the XAU/USD sellers after rising in the last two days in a row.
US Treasury bond yields portray the market’s inaction as Tuesday’s US activity numbers showed improvement for January but marked the seventh consecutive contraction in PMIs and kept the recession fears on the table.
Elsewhere, hawkish comments from the European Central Bank (ECB) officials ahead of the next week’s monetary policy contrasts with the market’s receding bets on the aggressive Fed rate hikes to confuse traders. “Fed fund futures see only two more quarter-point rate hikes by the Fed to a peak of around 5% by June, before it starts cutting rates later in the year. The Federal Reserve itself has insisted it still has 75 bps of increases in the pipeline,” said Reuters.
It’s worth observing that the strong inflation data in Australia and New Zealand earlier in the day also weighed on the Gold price amid fears of aggressive rate hikes from the Reserve Bank of Australia (RBA) and the Reserve Bank of New Zealand (RBNZ).
Against this backdrop, the S&P 500 Futures print mild losses but the stocks in the Asia-Pacific region trade mixed and support the currencies of the zone.
Moving on, Gold traders may witness sluggish moves and can pare recent gains ahead of Thursday’s US data dump comprising the monthly Durable Goods Orders, weekly Jobless Claims and the preliminary readings of the Q4 GDP. Above all, the next week’s Federal Open Market Committee (FOMC) meeting is the most important event for the XAU/USD traders to watch for clear directions.
Gold price takes a U-turn from the one-week-old ascending resistance line, around $1,942 by the press time, which in turn takes clues from the overbought RSI and looming bears on the MACD to keep sellers hopeful.
However, the 10-DMA support level surrounding $1,920 restricts the immediate downside of the Gold price.
Should the bright metal remains weak past $1,920, the previous weekly bottom near $1,896 could act as the last defense of the Gold buyers.
On the flip side, Gold’s successful trading above the adjacent resistance line, close to $1,942 at the latest, could propel the quote toward an ascending trend line from December 13, 2022, close to $1,962.
It should be noted that March 2022 peak near $1,966 could act as an extra filter to the north before highlighting the $2,000 psychological magnet.
Trend: Pullback expected
Technical Levels: Supports and Resistances
XAUUSD currently trading at 1932.26 at the time of writing. Pair opened at 1937.95 and is trading with a change of -0.29% % .
| Overview | Overview.1 | |
|---|---|---|
| 0 | Today last price | 1932.26 |
| 1 | Today Daily Change | -5.69 |
| 2 | Today Daily Change % | -0.29% |
| 3 | Today daily open | 1937.95 |
The pair remains strongly bullish on the daily timeframe. It trades above its 20 SMA @ 1878.11, 50 SMA 1818.87, 100 SMA @ 1748.69 and 200 SMA @ 1775.67.
| Trends | Trends.1 | |
|---|---|---|
| 0 | Daily SMA20 | 1878.11 |
| 1 | Daily SMA50 | 1818.87 |
| 2 | Daily SMA100 | 1748.69 |
| 3 | Daily SMA200 | 1775.67 |
The previous day high was 1942.57 while the previous day low was 1917.19. The daily 38.2% Fib levels comes at 1932.87, expected to provide resistance. Similarly, the daily 61.8% fib level is at 1926.89, expected to provide support.
Note the levels of interest below:
- Pivot support is noted at 1922.57, 1907.19, 1897.19
- Pivot resistance is noted at 1947.95, 1957.95, 1973.33
| Levels | Levels.1 |
|---|---|
| Previous Daily High | 1942.57 |
| Previous Daily Low | 1917.19 |
| Previous Weekly High | 1937.57 |
| Previous Weekly Low | 1896.63 |
| Previous Monthly High | 1833.38 |
| Previous Monthly Low | 1765.89 |
| Daily Fibonacci 38.2% | 1932.87 |
| Daily Fibonacci 61.8% | 1926.89 |
| Daily Pivot Point S1 | 1922.57 |
| Daily Pivot Point S2 | 1907.19 |
| Daily Pivot Point S3 | 1897.19 |
| Daily Pivot Point R1 | 1947.95 |
| Daily Pivot Point R2 | 1957.95 |
| Daily Pivot Point R3 | 1973.33 |
[/s2If]
Join Our Telegram Group
")


