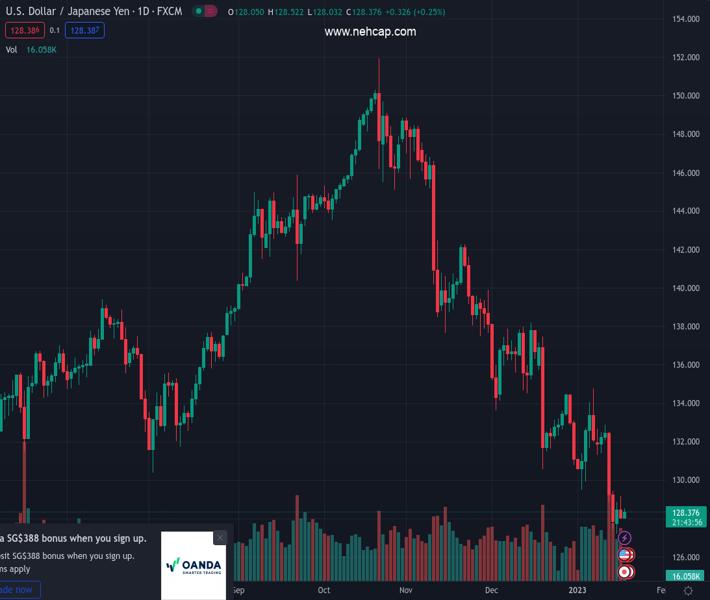
#USDJPY @ 128.410 struggles for clear directions around the lowest levels since June 2022. (Pivot Orderbook analysis)
…
This is a premium post.
[s2If !current_user_can(access_s2member_level4)]Please register for PREMIUM VERSION HERE to read full post below containing analysis. In case of any error or you think you are not able to read the full post below, please email us at support#nehcap.com [lwa][/s2If] [s2If current_user_can(access_s2member_level4)]
- USD/JPY struggles for clear directions around the lowest levels since June 2022.
- Mixed performance of bond markets, indecisive DXY despite downbeat catalysts put a floor under the prices.
- Markets have high hopes from BoJ after YCC tweak, upbeat Japan JGB fuelled JPY strength.
- Any disappointment could offer notable rebound of the Yen pair amid oversold RSI conditions.
The pair currently trades last at 128.410.
The previous day high was 129.16 while the previous day low was 127.99. The daily 38.2% Fib levels comes at 128.44, expected to provide resistance. Similarly, the daily 61.8% fib level is at 128.72, expected to provide resistance.
USD/JPY portrays the typical pre-event anxiety as it seesaws near 128.20-30, picking up bids of late, as markets in Tokyo open for the key Wednesday. In doing so, the Yen pair justifies the traders’ cautious mood ahead of the Bank of Japan’s (BoJ) monetary policy decision. It’s worth noting that the recent data from Japan seemed to underpin the quote’s corrective bounce after falling the most in a week the previous day.
That said, the Reuters Tankan index for Japan’s big manufacturers stood at -6 in January, down from +8 last month, to mark the first negative reading since January 2021. Additionally, Japan’s Machinery Orders for November slumped -8.3% MoM versus -0.9% forecast and 5.4% previous readings.
USD/JPY dropped the previous day as the Japanese Government Bond (JGB) yields infused strength into the JPY. That said, the 10-year JGB poked the highest levels since June 2014 the previous day while flashing 0.59% figure, just above the upper limit of the BoJ’s desired range.
Additionally, the US Dollar Index (DXY) marked a dismal closing around 102.35, after an initially positive performance, which in turn weighed on the USD/JPY prices previous day. However, the US Treasury bond yields allowed the US Dollar to remain firmer, downbeat prints of the New York manufacturing data, namely the Empire State Manufacturing Index for December, probed the US Dollar bulls and put a floor under the Gold price. That said, the NY Fed’s business gauge dropped sharply in January to -32.9 versus -4.5 market forecasts and -11.2 prior readings. The data also helped the Federal Reserve Bank of Richmond’s President and CEO Thomas Barkin to state, “My hope is that we have passed the peak of inflation.” As a result, the US Dollar bulls had a tough ride.
Against this backdrop, Wall Street closed mixed and the benchmark 10-year US Treasury bond yields ended the day with nearly four basis points (bps) of an upside to 3.55% even as the two-year counterpart retreated to 4.20%. That said, the S&P 500 Future print mild losses while the US Treasury bond yields remain firmer at the latest.
Looking forward, USD/JPY pair’s fate relies on how well the BoJ policymakers defend their easy money policy amid hopes of witnessing hints to an exit, especially after the last meetings surprise tweak into the Yields Curve Control (YCC) policy. Should the BoJ disappoints and announces no change, the USD/JPY may portray the much-awaited recovery.
Also read: Bank of Japan Preview: Expectations are high, but will the BoJ deliver?
Other than the BoJ verdict and comments from Governor Haruhiko Kuroda, US Retail Sales and the Producer Price Index (PPI) for December are also important for the USD/JPY traders. Forecasts suggest that the headlines US Retail Sales may improve with 0.1% monthly gains, versus the previous contraction of 0.6%, whereas the PPI is likely to ease to -0.1% from 0.3% prior.
Although a six-week-old descending trend line joins oversold RSI (14) to put a floor under the USD/JPY prices around 127.40, the pair buyers need successful trading beyond the May 2022 peak surrounding 131.35 to retake control.
Technical Levels: Supports and Resistances
USDJPY currently trading at 128.28 at the time of writing. Pair opened at 128.21 and is trading with a change of 0.05 % .
| Overview | Overview.1 | |
|---|---|---|
| 0 | Today last price | 128.28 |
| 1 | Today Daily Change | 0.07 |
| 2 | Today Daily Change % | 0.05 |
| 3 | Today daily open | 128.21 |
The pair remains strongly bearish on the daily time frame. It trades below the 20 SMA @ 131.65, 50 SMA 135.59, 100 SMA @ 140.42 and 200 SMA @ 136.67.
| Trends | Trends.1 | |
|---|---|---|
| 0 | Daily SMA20 | 131.65 |
| 1 | Daily SMA50 | 135.59 |
| 2 | Daily SMA100 | 140.42 |
| 3 | Daily SMA200 | 136.67 |
The previous day high was 129.16 while the previous day low was 127.99. The daily 38.2% Fib levels comes at 128.44, expected to provide resistance. Similarly, the daily 61.8% fib level is at 128.72, expected to provide resistance.
Note the levels of interest below:
- Pivot support is noted at 127.75, 127.28, 126.58
- Pivot resistance is noted at 128.92, 129.63, 130.09
| Levels | Levels.1 |
|---|---|
| Previous Daily High | 129.16 |
| Previous Daily Low | 127.99 |
| Previous Weekly High | 132.87 |
| Previous Weekly Low | 127.46 |
| Previous Monthly High | 138.18 |
| Previous Monthly Low | 130.57 |
| Daily Fibonacci 38.2% | 128.44 |
| Daily Fibonacci 61.8% | 128.72 |
| Daily Pivot Point S1 | 127.75 |
| Daily Pivot Point S2 | 127.28 |
| Daily Pivot Point S3 | 126.58 |
| Daily Pivot Point R1 | 128.92 |
| Daily Pivot Point R2 | 129.63 |
| Daily Pivot Point R3 | 130.09 |
[/s2If]
Join Our Telegram Group
")


