US Dollar Index picks up bids after the previous day’s mixed performance, mildly bid on weekly basis. (Pivot Orderbook analysis)
…
This is a premium post.
[s2If !current_user_can(access_s2member_level4)]Please register for PREMIUM VERSION HERE to read full post below containing analysis. In case of any error or you think you are not able to read the full post below, please email us at support#nehcap.com [lwa][/s2If] [s2If current_user_can(access_s2member_level4)]
- US Dollar Index picks up bids after the previous day’s mixed performance, mildly bid on weekly basis.
- Yields, downbeat Euro put a floor under the DXY but softer US data, unimpressive Fed talks weigh on prices.
- Recently mixed US consumer-centric data highlights today’s US Retail Sales, PPI for December as low expectations can trigger upside surprise.
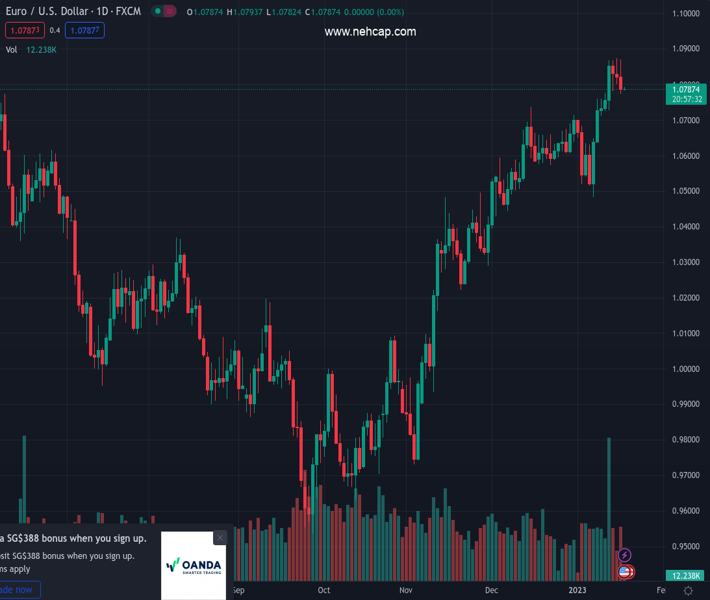
The pair currently trades last at 102.44.
The previous day high was 102.57 while the previous day low was 101.93. The daily 38.2% Fib levels comes at 102.32, expected to provide support. Similarly, the daily 61.8% fib level is at 102.17, expected to provide support.
US Dollar Index (DXY) holds onto the week-start recovery moves with a slower pace on early Wednesday. That said, the US Dollar’s gauge versus the six major currencies picks up bids to 102.40 as it struggles to overcome the lowest levels since June 2022.
The DXY marked a dismal closing around 102.35 the previous day, after an initially positive performance. The reason could be linked to the downbeat prints of the New York manufacturing data, namely the Empire State Manufacturing Index for December. That said, the NY Fed’s business gauge dropped sharply in January to -32.9 versus -4.5 market forecasts and -11.2 prior readings. The data also pushed the Federal Reserve Bank of Richmond’s President and CEO Thomas Barkin to state, “My hope is that we have passed the peak of inflation.” As a result, the US Dollar bulls had a tough ride.
However, the US Treasury bond yields allowed the US Dollar to remain firmer. That said, the benchmark 10-year US Treasury bond yields ended the day with nearly four basis points (bps) of an upside to 3.55%, mostly the same at the latest, even as the two-year counterpart retreated to 4.20%.
It should be noted that the previously downbeat inflation and activity data from the US contrasted with the strong US Michigan Consumer Sentiment Index and 5-year inflation expectations to put a floor under the US Dollar. Also likely to have challenged the DXY could be the recent optimism linked to China reopening and easing fears of the global economic slowdown. Even so, the swirling talks of the European Central Bank’s (ECB) slower rate hike starting after February, weighed on the bloc’s currency Euro (EUR) and allowed the US Dollar to remain firmer. The dovish concerns surrounding the ECB’s next move could be linked to Bloomberg’s news saying, “ECB policymakers are starting to consider a slower pace of interest-rate hikes after a likely 50 basis-point step in February.”
Against this backdrop, Wall Street closed mixed while the S&P 500 Futures printed mild losses by the press time.
Moving on, DXY traders should pay attention to the Treasury bond yields ahead of the US Retail Sales and the Producer Price Index (PPI) for December. Forecasts suggest that the headlines US Retail Sales may improve with 0.1% monthly gains, versus the previous contraction of 0.6%, whereas the PPI is likely to ease to -0.1% from 0.3% prior.
Tuesday’s Doji candlestick on the daily formation challenges the DXY’s corrective bounce off the lowest levels since June.
Technical Levels: Supports and Resistances
EURUSD currently trading at 102.44 at the time of writing. Pair opened at 102.39 and is trading with a change of 0.05 % .
| Overview | Overview.1 | |
|---|---|---|
| 0 | Today last price | 102.44 |
| 1 | Today Daily Change | 0.05 |
| 2 | Today Daily Change % | 0.05 |
| 3 | Today daily open | 102.39 |
The pair remains strongly bearish on the daily time frame. It trades below the 20 SMA @ 103.7, 50 SMA 104.75, 100 SMA @ 107.82 and 200 SMA @ 106.81.
| Trends | Trends.1 | |
|---|---|---|
| 0 | Daily SMA20 | 103.70 |
| 1 | Daily SMA50 | 104.75 |
| 2 | Daily SMA100 | 107.82 |
| 3 | Daily SMA200 | 106.81 |
The previous day high was 102.57 while the previous day low was 101.93. The daily 38.2% Fib levels comes at 102.32, expected to provide support. Similarly, the daily 61.8% fib level is at 102.17, expected to provide support.
Note the levels of interest below:
- Pivot support is noted at 102.03, 101.66, 101.39
- Pivot resistance is noted at 102.66, 102.93, 103.3
| Levels | Levels.1 |
|---|---|
| Previous Daily High | 102.57 |
| Previous Daily Low | 101.93 |
| Previous Weekly High | 103.95 |
| Previous Weekly Low | 101.99 |
| Previous Monthly High | 106.02 |
| Previous Monthly Low | 103.39 |
| Daily Fibonacci 38.2% | 102.32 |
| Daily Fibonacci 61.8% | 102.17 |
| Daily Pivot Point S1 | 102.03 |
| Daily Pivot Point S2 | 101.66 |
| Daily Pivot Point S3 | 101.39 |
| Daily Pivot Point R1 | 102.66 |
| Daily Pivot Point R2 | 102.93 |
| Daily Pivot Point R3 | 103.30 |
[/s2If]
Join Our Telegram Group
")


