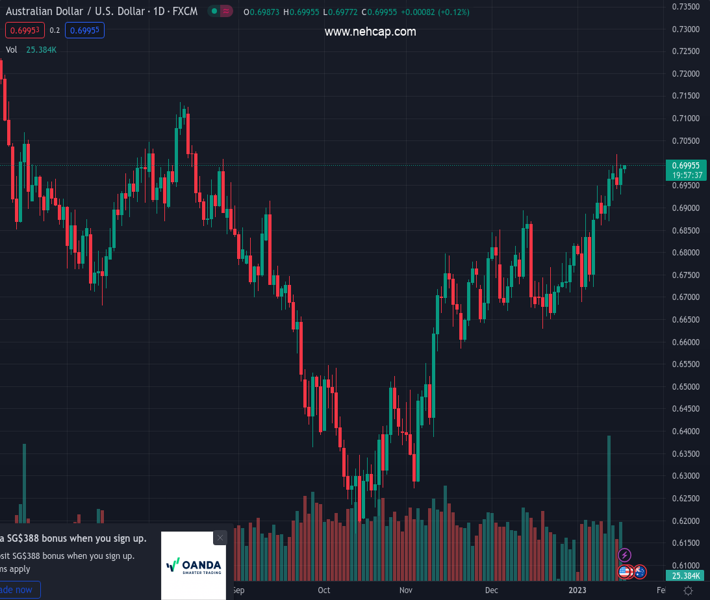
#AUDUSD @ 0.69921 remains sidelined around the highest levels in five months, recently picking up bids. (Pivot Orderbook analysis)
…
This is a premium post.
[s2If !current_user_can(access_s2member_level4)]Please register for PREMIUM VERSION HERE to read full post below containing analysis. In case of any error or you think you are not able to read the full post below, please email us at support#nehcap.com [lwa][/s2If] [s2If current_user_can(access_s2member_level4)]
- AUD/USD remains sidelined around the highest levels in five months, recently picking up bids.
- Market sentiment dwindles as traders await key data/events.
- Mixed concerns surrounding China, light calendar at home also probe Aussie pair buyers.
- Dismal hopes from US data could surprise traders as bulls seem to struggle of late.
The pair currently trades last at 0.69921.
The previous day high was 0.6997 while the previous day low was 0.693. The daily 38.2% Fib levels comes at 0.6971, expected to provide support. Similarly, the daily 61.8% fib level is at 0.6956, expected to provide support.
AUD/USD treads water around 0.6980-90 during early Wednesday, after reversing the week-start losses the previous day.
In doing so, the Aussie pair portrays the market’s indecision ahead of the key US Retail Sales and the Producer Price Index (PPI) for December. Also likely to challenge the market’s performance, as well as the Aussie pair, could be the immediate release of the Bank of Japan’s (BoJ) monetary policy announcements.
Additionally, expectations of upbeat growth figures from China, as conveyed by economists from Goldman Sachs of late, join the fears of more Sino-American tussles over Taiwan to challenge the AUD/USD pair traders. Earlier in the day, South China Morning Post (SCMP) mentioned that Beijing ‘should be wary’ as the US, Taiwan seeks closer economic ties.
Elsewhere, the US Dollar Index (DXY) picks up bids to print mild gains as DXY marked a dismal closing around 102.35 the previous day, after an initially positive performance, close to 102.50 at the latest. The reason could be linked to the downbeat prints of the New York manufacturing data, namely the Empire State Manufacturing Index for December.
That said, the NY Fed’s business gauge dropped sharply in January to -32.9 versus -4.5 market forecasts and -11.2 prior readings. The data also pushed the Federal Reserve Bank of Richmond’s President and CEO Thomas Barkin to state, “My hope is that we have passed the peak of inflation.” As a result, the US Dollar bulls had a tough ride.
Amid these plays, the benchmark 10-year US Treasury bond yields ended Tuesday with nearly four basis points (bps) of an upside to 3.55%, mostly the same at the latest, while the S&P 500 Future print mild losses by tracking mixed closing of Wall Street.
Looking ahead, AUD/USD could remain lackluster due to the pair’s risk-barometer status and the mixed sentiment in the market ahead of the key data/events. It’s worth noting, however, that the US Dollar appeared to have had enough downside and the scheduled releases may surprise the markets. As a result, the pair traders should remain cautious ahead of the aforementioned data/events.
That said, the BoJ isn’t expected to alter the monetary policy but a tweak to its Yields Curve Control (YCC), or dumping it, could propel the Yen and Japanese Government Bond yields, which in turn could weigh on the US Dollar and propel AUD/USD prices. Following that, US Retail Sales growth is expected to improve with 0.1% monthly increase versus the previous contraction of 0.6% whereas the PPI may ease to -0.1% from 0.3% prior.
A one-week-old ascending trend channel, currently between 0.7045 and 0.6775, keeps the AUD/USD buyers hopeful despite the quote’s latest inaction.
Technical Levels: Supports and Resistances
AUDUSD currently trading at 0.6987 at the time of writing. Pair opened at 0.6986 and is trading with a change of 0.01% % .
| Overview | Overview.1 | |
|---|---|---|
| 0 | Today last price | 0.6987 |
| 1 | Today Daily Change | 0.0001 |
| 2 | Today Daily Change % | 0.01% |
| 3 | Today daily open | 0.6986 |
The pair remains strongly bullish on the daily timeframe. It trades above its 20 SMA @ 0.6823, 50 SMA 0.6758, 100 SMA @ 0.6637 and 200 SMA @ 0.6827.
| Trends | Trends.1 | |
|---|---|---|
| 0 | Daily SMA20 | 0.6823 |
| 1 | Daily SMA50 | 0.6758 |
| 2 | Daily SMA100 | 0.6637 |
| 3 | Daily SMA200 | 0.6827 |
The previous day high was 0.6997 while the previous day low was 0.693. The daily 38.2% Fib levels comes at 0.6971, expected to provide support. Similarly, the daily 61.8% fib level is at 0.6956, expected to provide support.
Note the levels of interest below:
- Pivot support is noted at 0.6945, 0.6904, 0.6877
- Pivot resistance is noted at 0.7012, 0.7038, 0.708
| Levels | Levels.1 |
|---|---|
| Previous Daily High | 0.6997 |
| Previous Daily Low | 0.6930 |
| Previous Weekly High | 0.6994 |
| Previous Weekly Low | 0.6860 |
| Previous Monthly High | 0.6893 |
| Previous Monthly Low | 0.6629 |
| Daily Fibonacci 38.2% | 0.6971 |
| Daily Fibonacci 61.8% | 0.6956 |
| Daily Pivot Point S1 | 0.6945 |
| Daily Pivot Point S2 | 0.6904 |
| Daily Pivot Point S3 | 0.6877 |
| Daily Pivot Point R1 | 0.7012 |
| Daily Pivot Point R2 | 0.7038 |
| Daily Pivot Point R3 | 0.7080 |
[/s2If]
Join Our Telegram Group
")


