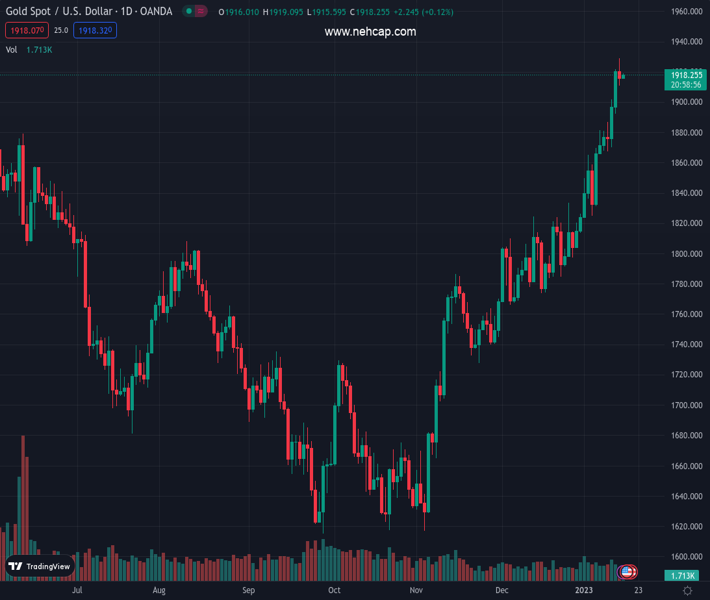
#XAUUSD @ 1,918.00 Gold price is marching towards $1,920.00 as the risk-off impulse is fading away. (Pivot Orderbook analysis)
…
This is a premium post.
[s2If !current_user_can(access_s2member_level4)]Please register for PREMIUM VERSION HERE to read full post below containing analysis. In case of any error or you think you are not able to read the full post below, please email us at support#nehcap.com [lwa][/s2If] [s2If current_user_can(access_s2member_level4)]
- Gold price is marching towards $1,920.00 as the risk-off impulse is fading away.
- A volatile action is expected from the US Dollar Index as the US markets are opening after a stretched weekend.
- A decline in the PPI figures is going to delight the Fed which is aiming to achieve price stability.
The pair currently trades last at 1918.00.
The previous day high was 1929.02 while the previous day low was 1910.91. The daily 38.2% Fib levels comes at 1917.83, expected to provide support. Similarly, the daily 61.8% fib level is at 1922.1, expected to provide resistance.
Gold price (XAU/USD) has scaled to near the critical resistance of $1,920.00 in the Asian session. The precious metal picked strength after sensing buying interest around $1,910.00 as the risk-off impulse is losing its grip.
S&P500 futures are aiming to recover their entire losses witnessed on Monday, portraying that investors are shrugging-off any sort of pessimism in an overall bullish market. The 10-year US Treasury yields have eased some gains and have dropped to 3.51%. Going forward, a volatile action is expected from the US Dollar Index (DXY) as the United States markets are opening after a stretched weekend.
Gold price is expected to display a power-pack action after the release of the US Producer Price Index (PPI) data, which will release on Wednesday. Investors should brace for a deceleration in the prices of goods and services at factory gates to match the decline in retail demand. A decline in the PPI figures is going to delight the Federal Reserve (Fed), which is making sheer efforts in achieving price stability in the US economy.
Apart from the US PPI, the release of the monthly Retail Sales data will be of utmost importance. As per the projections, the retail demand (Dec) will escalate by 0.1% vs. -0.6% reported earlier.
Gold price has corrected after printing a fresh eight-month high at $1,929.00 on an hourly scale. The precious metal has turned sideways in a narrow range of $1,911-1,919 as investors await US PPI data. The 20-period Exponential Moving Average (EMA) at $1,915.54 is overlapping with the asset prices, which indicates a consolidation ahead.
Also, the Relative Strength Index (RSI) (14) is oscillating in a 40.00-60.00 range, which indicates that the asset is rangebound.
Technical Levels: Supports and Resistances
XAUUSD currently trading at 1917.71 at the time of writing. Pair opened at 1914.43 and is trading with a change of 0.17 % .
| Overview | Overview.1 | |
|---|---|---|
| 0 | Today last price | 1917.71 |
| 1 | Today Daily Change | 3.28 |
| 2 | Today Daily Change % | 0.17 |
| 3 | Today daily open | 1914.43 |
The pair remains strongly bullish on the daily timeframe. It trades above its 20 SMA @ 1842.58, 50 SMA 1797.84, 100 SMA @ 1735.86 and 200 SMA @ 1776.96.
| Trends | Trends.1 | |
|---|---|---|
| 0 | Daily SMA20 | 1842.58 |
| 1 | Daily SMA50 | 1797.84 |
| 2 | Daily SMA100 | 1735.86 |
| 3 | Daily SMA200 | 1776.96 |
The previous day high was 1929.02 while the previous day low was 1910.91. The daily 38.2% Fib levels comes at 1917.83, expected to provide support. Similarly, the daily 61.8% fib level is at 1922.1, expected to provide resistance.
Note the levels of interest below:
- Pivot support is noted at 1907.22, 1900.01, 1889.11
- Pivot resistance is noted at 1925.33, 1936.23, 1943.44
| Levels | Levels.1 |
|---|---|
| Previous Daily High | 1929.02 |
| Previous Daily Low | 1910.91 |
| Previous Weekly High | 1921.96 |
| Previous Weekly Low | 1865.22 |
| Previous Monthly High | 1833.38 |
| Previous Monthly Low | 1765.89 |
| Daily Fibonacci 38.2% | 1917.83 |
| Daily Fibonacci 61.8% | 1922.10 |
| Daily Pivot Point S1 | 1907.22 |
| Daily Pivot Point S2 | 1900.01 |
| Daily Pivot Point S3 | 1889.11 |
| Daily Pivot Point R1 | 1925.33 |
| Daily Pivot Point R2 | 1936.23 |
| Daily Pivot Point R3 | 1943.44 |
[/s2If]
Join Our Telegram Group
")


