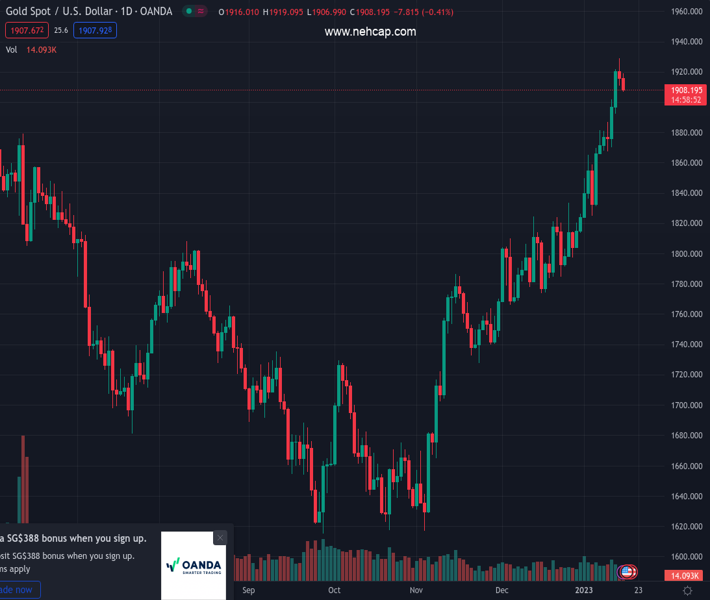
#XAUUSD @ 1,907.38 Gold price remains depressed for the second successive day amid a modest US Dollar strength. (Pivot Orderbook analysis)
…
This is a premium post.
[s2If !current_user_can(access_s2member_level4)]Please register for PREMIUM VERSION HERE to read full post below containing analysis. In case of any error or you think you are not able to read the full post below, please email us at support#nehcap.com [lwa][/s2If] [s2If current_user_can(access_s2member_level4)]
- Gold price remains depressed for the second successive day amid a modest US Dollar strength.
- A combination of factors should help limit any meaningful pullback from a multi-month peak.
- Bets for smaller Fed rate hikes could lend support amid the risk of a potential global recession.
The pair currently trades last at 1907.38.
The previous day high was 1929.02 while the previous day low was 1910.91. The daily 38.2% Fib levels comes at 1917.83, expected to provide resistance. Similarly, the daily 61.8% fib level is at 1922.1, expected to provide resistance.
Gold price edges lower for the second successive day on Tuesday and moves further away from its highest level since April, around the $1,929 region touched the previous day. The XAU/USD remains depressed heaving into the European session, though manages to hold its neck above the $1,900 round-figure mark.
The US Dollar (USD) is seen building on the overnight bounce from a seven-month low and gaining follow-through traction amid a modest uptick in the US Treasury bond yields. This turns out to be a key factor weighing on the US Dollar-denominated commodities, including Gold. That said, bets for a less aggressive policy tightening by the Federal Reserve (Fed) act as a headwind for the Greenback.
Investors seem convinced that the Fed will soften its hawkish stance in the wake of signs of easing inflationary pressures and the risk of a potential recession. Moreover, several members of the Federal Open Market Committee (FOMC) backed the case for smaller rate hikes and lifted bets for a 25 bps lift-off in February. This, in turn, should continue to lend some support to the non-yielding Gold price.
Furthermore, a softer risk tone might further contribute to limiting any meaningful downside for the safe-haven XAU/USD, at least for the time being. The market sentiment remains fragile amid worries about headwinds stemming from the worst yet COVID-19 outbreak in China. Adding to this, the protracted Russia-Ukraine war has been fueling concerns about a deeper global economic downturn.
This, to a larger extent, overshadows better-than-expected Chinese Gross Domestic Product (GDP) print, which showed that the economy grew at an annualized rate of 2.9% in the fourth quarter. Furthermore, improving trends in Chinese Retail Sales and Industrial Production fueled optimism over a recovery in the world’s second-largest economy. This, however, fails to boost investors’ confidence.
The aforementioned fundamental backdrop suggests that the path of least resistance for the Gold price is to the upside. Hence, any corrective pullback might be seen as a buying opportunity and is more likely to remain limited. Market participants now look to the release of the Empire State Manufacturing Index from the United States (US) for some impetus later during the early North American session.
From a technical perspective, the $1,900 mark could act as immediate support. Any further decline, however, is likely to attract fresh buyers near the $1,885-$1,880 region. The latter should act as a strong base for the Gold price, which if broken decisively might prompt some technical selling and pave the way for a deeper corrective decline. On the flip side, the multi-month high, around the $1,929 zone, now seems to act as an immediate hurdle. Some follow-through buying has the potential to lift the XAU/USD further towards the next relevant resistance near the $1,948-$1,950 area.
Technical Levels: Supports and Resistances
XAUUSD currently trading at 1909.93 at the time of writing. Pair opened at 1914.43 and is trading with a change of -0.24 % .
| Overview | Overview.1 | |
|---|---|---|
| 0 | Today last price | 1909.93 |
| 1 | Today Daily Change | -4.50 |
| 2 | Today Daily Change % | -0.24 |
| 3 | Today daily open | 1914.43 |
The pair remains strongly bullish on the daily timeframe. It trades above its 20 SMA @ 1842.58, 50 SMA 1797.84, 100 SMA @ 1735.86 and 200 SMA @ 1776.96.
| Trends | Trends.1 | |
|---|---|---|
| 0 | Daily SMA20 | 1842.58 |
| 1 | Daily SMA50 | 1797.84 |
| 2 | Daily SMA100 | 1735.86 |
| 3 | Daily SMA200 | 1776.96 |
The previous day high was 1929.02 while the previous day low was 1910.91. The daily 38.2% Fib levels comes at 1917.83, expected to provide resistance. Similarly, the daily 61.8% fib level is at 1922.1, expected to provide resistance.
Note the levels of interest below:
- Pivot support is noted at 1907.22, 1900.01, 1889.11
- Pivot resistance is noted at 1925.33, 1936.23, 1943.44
| Levels | Levels.1 |
|---|---|
| Previous Daily High | 1929.02 |
| Previous Daily Low | 1910.91 |
| Previous Weekly High | 1921.96 |
| Previous Weekly Low | 1865.22 |
| Previous Monthly High | 1833.38 |
| Previous Monthly Low | 1765.89 |
| Daily Fibonacci 38.2% | 1917.83 |
| Daily Fibonacci 61.8% | 1922.10 |
| Daily Pivot Point S1 | 1907.22 |
| Daily Pivot Point S2 | 1900.01 |
| Daily Pivot Point S3 | 1889.11 |
| Daily Pivot Point R1 | 1925.33 |
| Daily Pivot Point R2 | 1936.23 |
| Daily Pivot Point R3 | 1943.44 |
[/s2If]
Join Our Telegram Group
")


