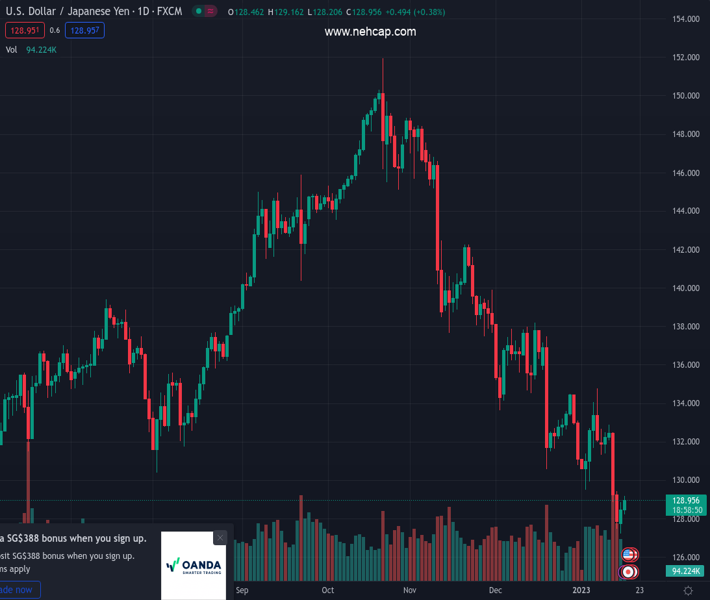
#USDJPY @ 128.996 picks up bids to extend the week-start rebound from the lowest levels since May 2022., @nehcap view: Further recovery expected (Pivot Orderbook analysis)
…
This is a premium post.
[s2If !current_user_can(access_s2member_level4)]Please register for PREMIUM VERSION HERE to read full post below containing analysis. In case of any error or you think you are not able to read the full post below, please email us at support#nehcap.com [lwa][/s2If] [s2If current_user_can(access_s2member_level4)]
- USD/JPY picks up bids to extend the week-start rebound from the lowest levels since May 2022.
- Upbeat RSI backs confirmation of bullish chart pattern to tease buyers.
- 200-HMA acts as final defense of buyers, 50-HMA guards immediate downside.
The pair currently trades last at 128.996.
The previous day high was 128.87 while the previous day low was 127.22. The daily 38.2% Fib levels comes at 128.24, expected to provide support. Similarly, the daily 61.8% fib level is at 127.85, expected to provide support.
USD/JPY refreshes intraday high around 129.15 as it pierces the neckline of a two-day-old inverse head-and-shoulders (H&S) bullish chart pattern during early Tuesday, retreating to 129.00 by the press time.
Not only the inverse H&S confirmation but the upbeat RSI (14), not overbought, also adds strength to the USD/JPY rebound from the lowest levels since late May 2022.
As a result, the Yen pair buyers are well-set to approach the 130.00 round figure before aiming for the theoretical target surrounding 130.40.
It’s worth observing that the RSI line is approaching the overbought territory and may probe the USD/JPY bulls around 130.40, if not then the 200-HMA level surrounding 131.25 will be in focus. Additionally, the 131.00 round figure could act as an extra filter towards the north.
On the flip side, the resistance-turned-support line of the stated inverse H&S, around 128.75 by the press time, restricts the immediate downside of the USD/JPY pair ahead of the 50-HMA level near 128.30.
In a case where the Yen pair remains bearish past 128.30, the monthly low around 127.20 and May 2022 low near 126.35 will gain the market’s attention.
Overall, USD/JPY is likely to witness further recovery but the upside room appears limited.
Trend: Further recovery expected
Technical Levels: Supports and Resistances
USDJPY currently trading at 128.96 at the time of writing. Pair opened at 128.54 and is trading with a change of 0.33% % .
| Overview | Overview.1 | |
|---|---|---|
| 0 | Today last price | 128.96 |
| 1 | Today Daily Change | 0.42 |
| 2 | Today Daily Change % | 0.33% |
| 3 | Today daily open | 128.54 |
The pair remains strongly bearish on the daily time frame. It trades below the 20 SMA @ 131.83, 50 SMA 135.94, 100 SMA @ 140.53 and 200 SMA @ 136.65.
| Trends | Trends.1 | |
|---|---|---|
| 0 | Daily SMA20 | 131.83 |
| 1 | Daily SMA50 | 135.94 |
| 2 | Daily SMA100 | 140.53 |
| 3 | Daily SMA200 | 136.65 |
The previous day high was 128.87 while the previous day low was 127.22. The daily 38.2% Fib levels comes at 128.24, expected to provide support. Similarly, the daily 61.8% fib level is at 127.85, expected to provide support.
Note the levels of interest below:
- Pivot support is noted at 127.55, 126.56, 125.91
- Pivot resistance is noted at 129.2, 129.86, 130.85
| Levels | Levels.1 |
|---|---|
| Previous Daily High | 128.87 |
| Previous Daily Low | 127.22 |
| Previous Weekly High | 132.87 |
| Previous Weekly Low | 127.46 |
| Previous Monthly High | 138.18 |
| Previous Monthly Low | 130.57 |
| Daily Fibonacci 38.2% | 128.24 |
| Daily Fibonacci 61.8% | 127.85 |
| Daily Pivot Point S1 | 127.55 |
| Daily Pivot Point S2 | 126.56 |
| Daily Pivot Point S3 | 125.91 |
| Daily Pivot Point R1 | 129.20 |
| Daily Pivot Point R2 | 129.86 |
| Daily Pivot Point R3 | 130.85 |
[/s2If]
Join Our Telegram Group
")


