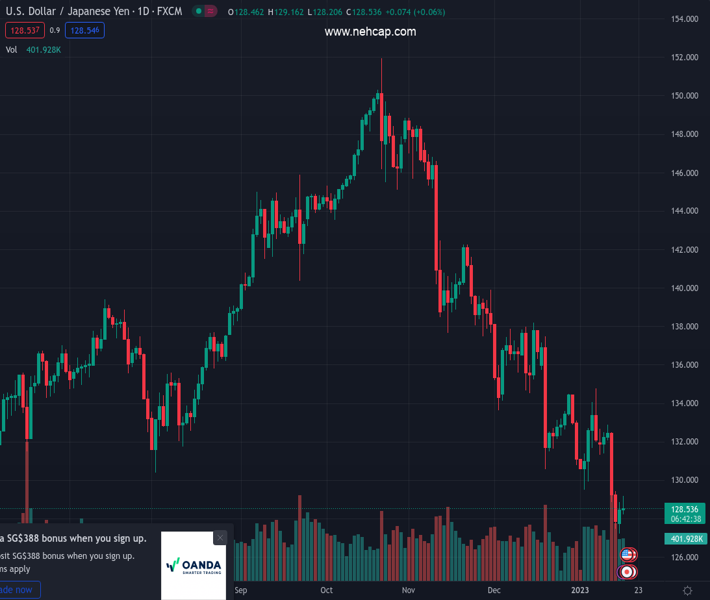
#USDJPY @ 128.511 A risk-off impulse, and speculations for the Bank of Japan quitting its YCC, are headwinds for the . (Pivot Orderbook analysis)
…
This is a premium post.
[s2If !current_user_can(access_s2member_level4)]Please register for PREMIUM VERSION HERE to read full post below containing analysis. In case of any error or you think you are not able to read the full post below, please email us at support#nehcap.com [lwa][/s2If] [s2If current_user_can(access_s2member_level4)]
- A risk-off impulse, and speculations for the Bank of Japan quitting its YCC, are headwinds for the USD/JPY.
- The New York Fed Empire State Manufacturing report showed further deterioration in the region, sparking recession fears,
- USD/JPY Price Analysis: Failure to clear 129.40s exacerbated a drop below 129.00.
The pair currently trades last at 128.511.
The previous day high was 128.87 while the previous day low was 127.22. The daily 38.2% Fib levels comes at 128.24, expected to provide support. Similarly, the daily 61.8% fib level is at 127.85, expected to provide support.
USD/JPY clings to its earlier gains as the North American session begins, though it’s retracing after hitting daily highs of 129.16 before the Wall Street open. The US Dollar (USD) is giving back earlier gains while sentiment continues to deteriorate. At the time of writing, the USD/JPY is trading at 128.46, up by 0.11%.
Wall Street is set to open lower as US stock futures remain in negative territory. The greenback is fallen off the cliff, as shown by the US Dollar Index, down 0.57% at 101.984. The US 10-year Treasury bond yield, which usually correlates closely with the USD/JPY pair, trims its gains and sits at 3.535%, unchanged.
The US Empire State Manufacturing Report revealed by the New York Federal Reserve showed that business activity contracted sharply, with the index falling 22 points to -32.9. The report showed that new orders and shipments declined substantially, while delivery times were unchanged and inventories aimed higher.
Even though the data was worse than expected, the USD/JPY reaction to it was muted as traders braced for the two-day monetary policy decision of the Bank of Japan.
Expectations for a rate hike are very slim, though the March meeting jumped by 45%. Market analysts think that the BoJ could abandon its Yield Curve Control (YCC) to prepare the markets for its first rate hike at March or April’s meeting.
Ahead of the week, the US economic docket will feature the New York Fed President John Williams crossing the media. On the Japanese front, the Reuters Tankan Index, Machinery Orders, and the so-awaited Bank of Japan monetary policy decision would entertain USD/JPY traders.
During the European session, the USD/JPY hit a daily high at 129.16 before pairing those gains. The rally stalled below last Friday’s high of 129.42, which exacerbated the drop toward 128.50. Hence, price action edging lower, oscillators like the Relative Strength Index (RSI) remaining in bearish territory, and the Rate of Change (RoC) pushing further to the downside paved the way for further losses.
Therefore, the USD/JPY first support would be the 128.00 figure, followed by the January 16 daily low of 127.21 and the May 24 pivot low of 126.36.
Technical Levels: Supports and Resistances
USDJPY currently trading at 128.29 at the time of writing. Pair opened at 128.54 and is trading with a change of -0.19 % .
| Overview | Overview.1 | |
|---|---|---|
| 0 | Today last price | 128.29 |
| 1 | Today Daily Change | -0.25 |
| 2 | Today Daily Change % | -0.19 |
| 3 | Today daily open | 128.54 |
The pair remains strongly bearish on the daily time frame. It trades below the 20 SMA @ 131.83, 50 SMA 135.94, 100 SMA @ 140.53 and 200 SMA @ 136.65.
| Trends | Trends.1 | |
|---|---|---|
| 0 | Daily SMA20 | 131.83 |
| 1 | Daily SMA50 | 135.94 |
| 2 | Daily SMA100 | 140.53 |
| 3 | Daily SMA200 | 136.65 |
The previous day high was 128.87 while the previous day low was 127.22. The daily 38.2% Fib levels comes at 128.24, expected to provide support. Similarly, the daily 61.8% fib level is at 127.85, expected to provide support.
Note the levels of interest below:
- Pivot support is noted at 127.55, 126.56, 125.91
- Pivot resistance is noted at 129.2, 129.86, 130.85
| Levels | Levels.1 |
|---|---|
| Previous Daily High | 128.87 |
| Previous Daily Low | 127.22 |
| Previous Weekly High | 132.87 |
| Previous Weekly Low | 127.46 |
| Previous Monthly High | 138.18 |
| Previous Monthly Low | 130.57 |
| Daily Fibonacci 38.2% | 128.24 |
| Daily Fibonacci 61.8% | 127.85 |
| Daily Pivot Point S1 | 127.55 |
| Daily Pivot Point S2 | 126.56 |
| Daily Pivot Point S3 | 125.91 |
| Daily Pivot Point R1 | 129.20 |
| Daily Pivot Point R2 | 129.86 |
| Daily Pivot Point R3 | 130.85 |
[/s2If]
Join Our Telegram Group
")


