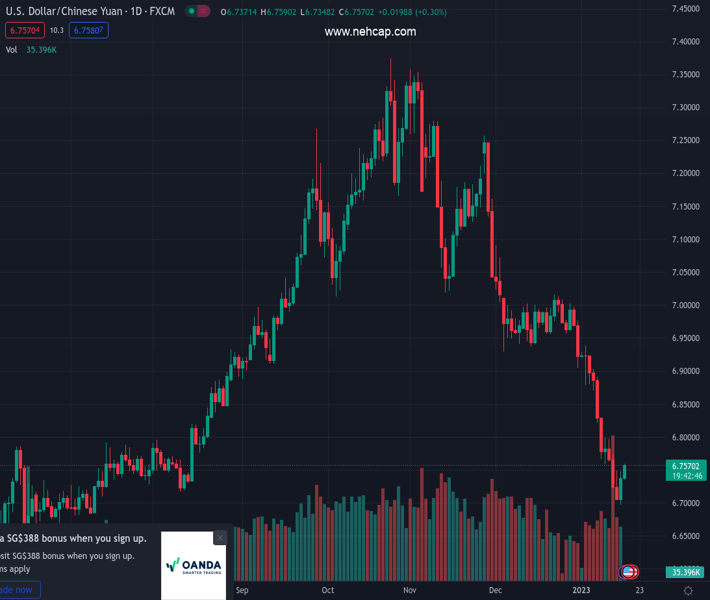
#USDCNH @ 6.75400 has crossed the crucial resistance of 6.7500 amid a recovery in the US Dollar Index. (Pivot Orderbook analysis)
…
This is a premium post.
[s2If !current_user_can(access_s2member_level4)]Please register for PREMIUM VERSION HERE to read full post below containing analysis. In case of any error or you think you are not able to read the full post below, please email us at support#nehcap.com [lwa][/s2If] [s2If current_user_can(access_s2member_level4)]
- USD/CNH has crossed the crucial resistance of 6.7500 amid a recovery in the US Dollar Index.
- Upbeat China’s GDP, Retail Sales, and Industrial Production data failed to provide support to the Chinese Yuan.
- S&P500 futures have eased morning gains, portraying a risk-off market mood.
The pair currently trades last at 6.75400.
The previous day high was 6.748 while the previous day low was 6.6976. The daily 38.2% Fib levels comes at 6.7288, expected to provide support. Similarly, the daily 61.8% fib level is at 6.7168, expected to provide support.
The USD/CNH has overstepped the critical resistance of 6.7500 despite China’s National Bureau of Statistics (NBS) having reported upbeat Gross Domestic Product (GDP) (Q4) data. The Chinese economy has expanded by 2.9% on an annual basis while the street was expecting an expansion of 1.8%, lower than the prior release of 3.9%. On a quarterly basis, the economy has remained steady but managed to avoid contraction as investors were expecting a de-growth by 0.8%.
Apart from that, annual Industrial Production (Dec) has been reported stronger than anticipated at 1.3% vs. the expectations of 0.5% but lower than the former release of 2.2%. The annual Retail Sales have contracted lower than expected by 1.8% against the estimate of -7.8%.
Broadly, the reopening reforms by the Chinese administration by shrugging-off uncertainty over rising Covid-19 cases are supporting a rally in commodities ahead. Usually, reopening measures boost liquidity in the economy, which initially strengthens the commodities, as witnessed in the case of reopening by other Western nations in CY2020 after the Covid-19 pandemic.
Economists at Société Générale think that China’s reopening will be bullish for commodities. They further added that “China should import more LNG which would put some pressure on gas prices and positive sentiment on the Copper markets will be significant. Oil prices have already displayed a bumper recovery
Meanwhile, the S&P500 futures have surrendered gains recorded in early Asia and have turned negative, portraying escalating caution among the market participants. The return on 10-year US Treasury bonds has jumped above 3.53%, which is weighing on the risk appetite of the market participants. The US Dollar Index (DXY) is aiming to recapture Monday’s high at 102.20 as the risk aversion theme is gaining traction.
Technical Levels: Supports and Resistances
USDCNH currently trading at 6.7566 at the time of writing. Pair opened at 6.746 and is trading with a change of 0.16 % .
| Overview | Overview.1 | |
|---|---|---|
| 0 | Today last price | 6.7566 |
| 1 | Today Daily Change | 0.0106 |
| 2 | Today Daily Change % | 0.1600 |
| 3 | Today daily open | 6.7460 |
The pair remains strongly bearish on the daily time frame. It trades below the 20 SMA @ 6.8912, 50 SMA 7.0018, 100 SMA @ 7.0609 and 200 SMA @ 6.8823.
| Trends | Trends.1 | |
|---|---|---|
| 0 | Daily SMA20 | 6.8912 |
| 1 | Daily SMA50 | 7.0018 |
| 2 | Daily SMA100 | 7.0609 |
| 3 | Daily SMA200 | 6.8823 |
The previous day high was 6.748 while the previous day low was 6.6976. The daily 38.2% Fib levels comes at 6.7288, expected to provide support. Similarly, the daily 61.8% fib level is at 6.7168, expected to provide support.
Note the levels of interest below:
- Pivot support is noted at 6.713, 6.68, 6.6626
- Pivot resistance is noted at 6.7636, 6.781, 6.8141
| Levels | Levels.1 |
|---|---|
| Previous Daily High | 6.7480 |
| Previous Daily Low | 6.6976 |
| Previous Weekly High | 6.8314 |
| Previous Weekly Low | 6.7056 |
| Previous Monthly High | 7.0914 |
| Previous Monthly Low | 6.9050 |
| Daily Fibonacci 38.2% | 6.7288 |
| Daily Fibonacci 61.8% | 6.7168 |
| Daily Pivot Point S1 | 6.7130 |
| Daily Pivot Point S2 | 6.6800 |
| Daily Pivot Point S3 | 6.6626 |
| Daily Pivot Point R1 | 6.7636 |
| Daily Pivot Point R2 | 6.7810 |
| Daily Pivot Point R3 | 6.8141 |
[/s2If]
Join Our Telegram Group
")


