#USDCHF @ 0.92085 remains below the 20-day EMA, unable to reclaim 0.9300. (Pivot Orderbook analysis)
…
This is a premium post.
[s2If !current_user_can(access_s2member_level4)]Please register for PREMIUM VERSION HERE to read full post below containing analysis. In case of any error or you think you are not able to read the full post below, please email us at support#nehcap.com [lwa][/s2If] [s2If current_user_can(access_s2member_level4)]
- USD/CHF remains below the 20-day EMA, unable to reclaim 0.9300.
- Although the pair is bearish, solid USD/CHF support to be found around 0.9150.
- If the USD/CHF climbs above the 20-day EMA, that will expose the 0.93 figure, followed by the 50-day EMA.
The pair currently trades last at 0.92085.
The previous day high was 0.9288 while the previous day low was 0.9219. The daily 38.2% Fib levels comes at 0.9262, expected to provide resistance. Similarly, the daily 61.8% fib level is at 0.9245, expected to provide resistance.
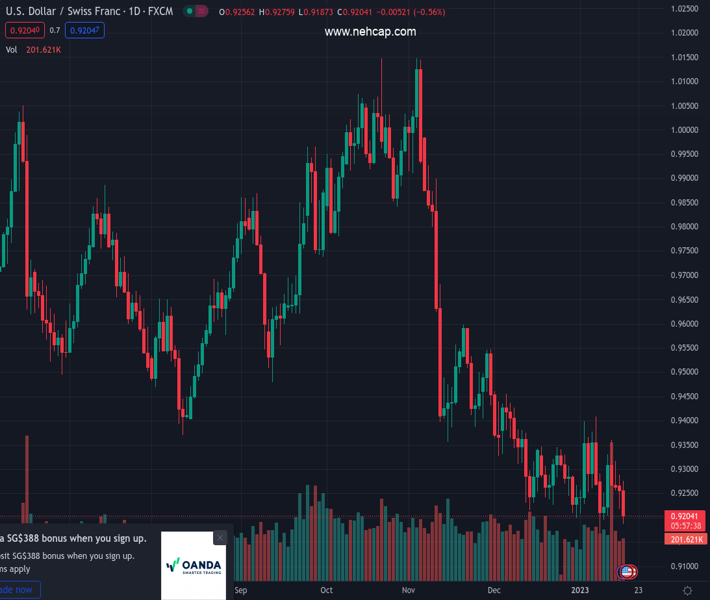
After failing to clear 0.9360 during the last week, the USD/CHF is extending its downtrend to four consecutive days, staying just below the 20-day Exponential Moving Average (EMA), which sits at around 0.9282, acting as a solid resistance. Hence, the USD/CHF is trading at 0.9213, below its opening price by 0.44%.
The USD/CHF is neutral-to-downward biased and continues to trade beneath the confluence of a three-month-old downslope trendline and the 20-day EMA. Although the bias suggests further downside, since December 2022, the USD/CHF bottomed around the February 2022 low of 0.9150 and remains unable to crack it. Therefore, bears need to clear the latter, to open the door towards 0.9100 first and then the 0.9000 figure.
As an alternate scenario, if the USD/CHF pair reclaims the 20-day EMA, that could send the pair climbing to 0.9300, followed by the January 12 high of 0.9360, ahead of the 0.9400 mark.
Technical Levels: Supports and Resistances
USDCHF currently trading at 0.9219 at the time of writing. Pair opened at 0.9263 and is trading with a change of -0.48 % .
| Overview | Overview.1 | |
|---|---|---|
| 0 | Today last price | 0.9219 |
| 1 | Today Daily Change | -0.0044 |
| 2 | Today Daily Change % | -0.4800 |
| 3 | Today daily open | 0.9263 |
The pair remains strongly bearish on the daily time frame. It trades below the 20 SMA @ 0.9284, 50 SMA 0.9385, 100 SMA @ 0.962 and 200 SMA @ 0.9643.
| Trends | Trends.1 | |
|---|---|---|
| 0 | Daily SMA20 | 0.9284 |
| 1 | Daily SMA50 | 0.9385 |
| 2 | Daily SMA100 | 0.9620 |
| 3 | Daily SMA200 | 0.9643 |
The previous day high was 0.9288 while the previous day low was 0.9219. The daily 38.2% Fib levels comes at 0.9262, expected to provide resistance. Similarly, the daily 61.8% fib level is at 0.9245, expected to provide resistance.
Note the levels of interest below:
- Pivot support is noted at 0.9225, 0.9187, 0.9155
- Pivot resistance is noted at 0.9295, 0.9326, 0.9364
| Levels | Levels.1 |
|---|---|
| Previous Daily High | 0.9288 |
| Previous Daily Low | 0.9219 |
| Previous Weekly High | 0.9363 |
| Previous Weekly Low | 0.9167 |
| Previous Monthly High | 0.9471 |
| Previous Monthly Low | 0.9201 |
| Daily Fibonacci 38.2% | 0.9262 |
| Daily Fibonacci 61.8% | 0.9245 |
| Daily Pivot Point S1 | 0.9225 |
| Daily Pivot Point S2 | 0.9187 |
| Daily Pivot Point S3 | 0.9155 |
| Daily Pivot Point R1 | 0.9295 |
| Daily Pivot Point R2 | 0.9326 |
| Daily Pivot Point R3 | 0.9364 |
[/s2If]
Join Our Telegram Group
")


