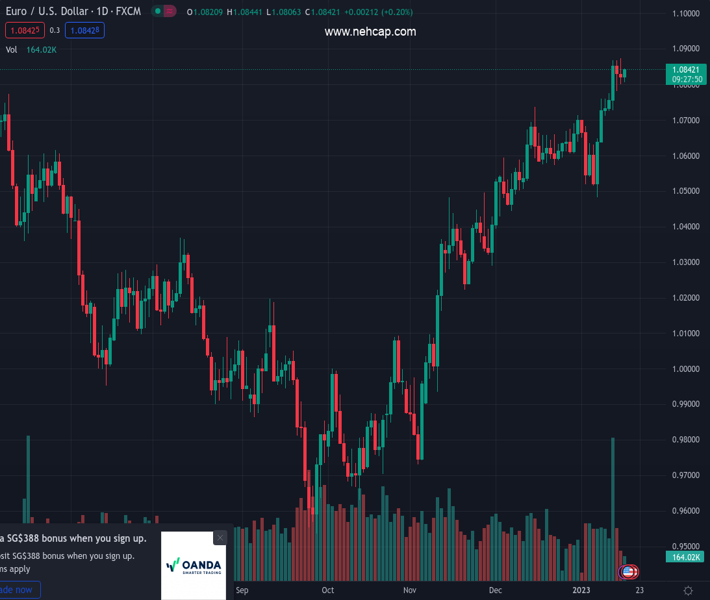
#EURUSD @ 1.08421 picks up some upside traction following the recent drop. (Pivot Orderbook analysis)
…
This is a premium post.
[s2If !current_user_can(access_s2member_level4)]Please register for PREMIUM VERSION HERE to read full post below containing analysis. In case of any error or you think you are not able to read the full post below, please email us at support#nehcap.com [lwa][/s2If] [s2If current_user_can(access_s2member_level4)]
- EUR/USD picks up some upside traction following the recent drop.
- Occasional bullish attempts need to surpass 1.0874.
The pair currently trades last at 1.08421.
The previous day high was 1.0874 while the previous day low was 1.0802. The daily 38.2% Fib levels comes at 1.0829, expected to provide support. Similarly, the daily 61.8% fib level is at 1.0846, expected to provide resistance.
EUR/USD now looks somewhat consolidative and attempts to leave behind the recent couple of sessions in the negative territory.
It seems the pair is moving into a consolidation phase ahead of the potential resumption of the uptrend. Against that, further north of the so far YTD high at 1.0874 (January 16) should appear the round level at 1.0900 in the relatively short-term horizon.
Furthermore, while above the short-term support line near 1.0580, extra gains should remain in store.
In the longer run, the constructive view remains unchanged while above the 200-day SMA at 1.0308.
Technical Levels: Supports and Resistances
EURUSD currently trading at 1.0832 at the time of writing. Pair opened at 1.0821 and is trading with a change of 0.1 % .
| Overview | Overview.1 | |
|---|---|---|
| 0 | Today last price | 1.0832 |
| 1 | Today Daily Change | 32.0000 |
| 2 | Today Daily Change % | 0.1000 |
| 3 | Today daily open | 1.0821 |
The pair remains strongly bullish on the daily timeframe. It trades above its 20 SMA @ 1.067, 50 SMA 1.0518, 100 SMA @ 1.0199 and 200 SMA @ 1.031.
| Trends | Trends.1 | |
|---|---|---|
| 0 | Daily SMA20 | 1.0670 |
| 1 | Daily SMA50 | 1.0518 |
| 2 | Daily SMA100 | 1.0199 |
| 3 | Daily SMA200 | 1.0310 |
The previous day high was 1.0874 while the previous day low was 1.0802. The daily 38.2% Fib levels comes at 1.0829, expected to provide support. Similarly, the daily 61.8% fib level is at 1.0846, expected to provide resistance.
Note the levels of interest below:
- Pivot support is noted at 1.079, 1.0759, 1.0717
- Pivot resistance is noted at 1.0863, 1.0905, 1.0935
| Levels | Levels.1 |
|---|---|
| Previous Daily High | 1.0874 |
| Previous Daily Low | 1.0802 |
| Previous Weekly High | 1.0868 |
| Previous Weekly Low | 1.0639 |
| Previous Monthly High | 1.0736 |
| Previous Monthly Low | 1.0393 |
| Daily Fibonacci 38.2% | 1.0829 |
| Daily Fibonacci 61.8% | 1.0846 |
| Daily Pivot Point S1 | 1.0790 |
| Daily Pivot Point S2 | 1.0759 |
| Daily Pivot Point S3 | 1.0717 |
| Daily Pivot Point R1 | 1.0863 |
| Daily Pivot Point R2 | 1.0905 |
| Daily Pivot Point R3 | 1.0935 |
[/s2If]
Join Our Telegram Group
")


