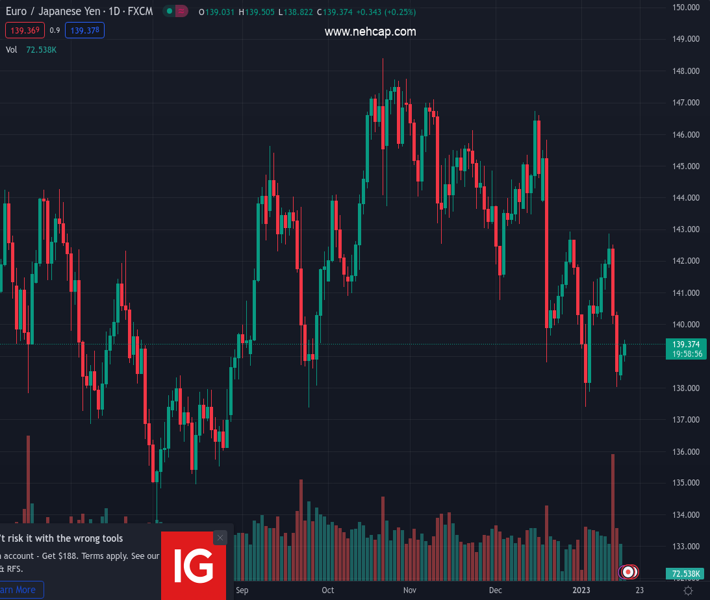
#EURJPY @ 139.332 has managed to retreat back into the consolidation area placed in a range of 138.84-143.00. (Pivot Orderbook analysis)
…
This is a premium post.
[s2If !current_user_can(access_s2member_level4)]Please register for PREMIUM VERSION HERE to read full post below containing analysis. In case of any error or you think you are not able to read the full post below, please email us at support#nehcap.com [lwa][/s2If] [s2If current_user_can(access_s2member_level4)]
- EUR/JPY has managed to retreat back into the consolidation area placed in a range of 138.84-143.00.
- The cross has picked strength as anxiety among investors soars ahead of BOJ policy.
- A range shift by the RSI (14) into the 40.00-60.00 from the bearish territory indicates that the downside momentum has faded,
The pair currently trades last at 139.332.
The previous day high was 139.3 while the previous day low was 138.24. The daily 38.2% Fib levels comes at 138.89, expected to provide support. Similarly, the daily 61.8% fib level is at 138.64, expected to provide support.
The EUR/JPY pair has sensed a buying interest after a marginal correction to near 139.00 in the Tokyo session. The cross has resumed its upside journey and has surpassed the immediate resistance of 139.30. The asset is gaining strength ahead of the monetary policy announcement by the Bank of Japan (BoJ).
Investors will keep an eye on commentary from BOJ Governor Haruhiko Kuroda amid growing chatters over an exit from the ultra-loose monetary policy by the BOJ.
EUR/JPY has managed to retreat back into the consolidation area placed in a range of 138.84-143.00. The cross sensed a responsive buying action after dropping to near 138.00 last week. A recovery move by the Euro is pushing the asset toward the 20-period Exponential Moving Average (EMA) at 139.56, which might strengthen the shared currency bulls further.
A range shift move by the Relative Strength Index (RSI) (14) from the bearish region of 20.00-40.00 to the 40.00-60.00 territory is indicating that the downside momentum has almost faded now.
For further upside, a break above January 5 low at 139.97 will drive the asset towards January 6 high at 141.45 followed by December 28 high around 143.00.
On the flip side, a downside move below the previous week’s low at 138.00 will drag the cross toward January 3 low at 137.39. A slippage below the latter will expose the asset for more downside toward April 14 low at 135.51.
Technical Levels: Supports and Resistances
EURJPY currently trading at 139.44 at the time of writing. Pair opened at 139.09 and is trading with a change of 0.25 % .
| Overview | Overview.1 | |
|---|---|---|
| 0 | Today last price | 139.44 |
| 1 | Today Daily Change | 0.35 |
| 2 | Today Daily Change % | 0.25 |
| 3 | Today daily open | 139.09 |
The pair remains strongly bearish on the daily time frame. It trades below the 20 SMA @ 140.65, 50 SMA 142.91, 100 SMA @ 143.14 and 200 SMA @ 140.72.
| Trends | Trends.1 | |
|---|---|---|
| 0 | Daily SMA20 | 140.65 |
| 1 | Daily SMA50 | 142.91 |
| 2 | Daily SMA100 | 143.14 |
| 3 | Daily SMA200 | 140.72 |
The previous day high was 139.3 while the previous day low was 138.24. The daily 38.2% Fib levels comes at 138.89, expected to provide support. Similarly, the daily 61.8% fib level is at 138.64, expected to provide support.
Note the levels of interest below:
- Pivot support is noted at 138.45, 137.81, 137.39
- Pivot resistance is noted at 139.52, 139.94, 140.58
| Levels | Levels.1 |
|---|---|
| Previous Daily High | 139.30 |
| Previous Daily Low | 138.24 |
| Previous Weekly High | 142.86 |
| Previous Weekly Low | 138.01 |
| Previous Monthly High | 146.73 |
| Previous Monthly Low | 138.80 |
| Daily Fibonacci 38.2% | 138.89 |
| Daily Fibonacci 61.8% | 138.64 |
| Daily Pivot Point S1 | 138.45 |
| Daily Pivot Point S2 | 137.81 |
| Daily Pivot Point S3 | 137.39 |
| Daily Pivot Point R1 | 139.52 |
| Daily Pivot Point R2 | 139.94 |
| Daily Pivot Point R3 | 140.58 |
[/s2If]
Join Our Telegram Group
")


