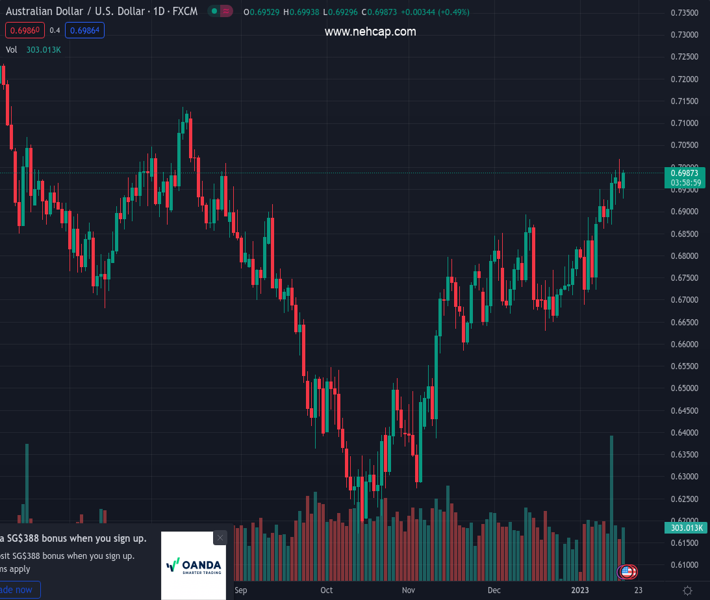
#AUDUSD @ 0.69833 The Australian Dollar got bolstered by China’s upbeat GDP and improvement in Australia’s consumer sentiment. (Pivot Orderbook analysis)
…
This is a premium post.
[s2If !current_user_can(access_s2member_level4)]Please register for PREMIUM VERSION HERE to read full post below containing analysis. In case of any error or you think you are not able to read the full post below, please email us at support#nehcap.com [lwa][/s2If] [s2If current_user_can(access_s2member_level4)]
- The Australian Dollar got bolstered by China’s upbeat GDP and improvement in Australia’s consumer sentiment.
- New York Fed Empire State Manufacturing Index plunged as business conditions deteriorated, augmenting speculations for a Fed pivot.
- AUD/USD traders are eyeing Fed speaking, US PPI, Retail Sales, and Australia’s employment data.
The pair currently trades last at 0.69833.
The previous day high was 0.7019 while the previous day low was 0.6941. The daily 38.2% Fib levels comes at 0.6971, expected to provide support. Similarly, the daily 61.8% fib level is at 0.6989, expected to provide resistance.
The Australian Dollar (AUD) is trimming some of its Monday’s losses and rising due to an offered US Dollar (USD) across the board, despite a dampened market mood surrounding Wall Street. US corporate earnings would likely continue to drive the market sentiment amidst the lack of tier 1 data. At the time of writing, the AUD/USD is trading at 0.6974.
Wall Street continues to lose traction as sentiment turns sour. US data released ahead of the US cash market equities open showed that Manufacturing activity in New York plunged to its lowest in January, as reported by the New York Federal Reserve (Fed). Delving into the report, business activity contracted sharply, with the index falling 22 points to -32.9. The report showed that new orders and shipments declined substantially, while delivery times were unchanged and inventories aimed higher.
The softer-than-expected data spurred a jump in the AUD/USD pair, reaching a new daily high of 0.6993, before retracing some of its gains. Meanwhile, the US Dollar Index, which tracks the buck’s value against a basket of six currencies, retraces 0.11%, down at 102.448, undermined by falling US Treasury bond yields.
On the Australian side, upbeat data from China, mainly the Gross Domestic Product (GDP) beating expectations of 1.6%, at 2.9% for Q4, bolstered the Aussie Dollar (AUD). Regarding the annual based data, China’s GDP came at 3%, well below the Communist Party’s 5% projection, and trailed 2021 by 8.1%.
Even though China’s data for the entire year disappointed, its reopening is being cheered by market investors, as the Hang Seng has risen almost 14% since the beginning of 2023. Further, the release of Australian consumer sentiment improved for the second consecutive month at 5.0%, vs. 3.0% in December.
Ahead of the week, the US economic docket will feature the New York Fed President John Williams, crossing newswires Tuesday. On Wednesday, the calendar will feature Retail Sales, prices paid by producers (PPI), and further Fed speaking.
Technical Levels: Supports and Resistances
AUDUSD currently trading at 0.6979 at the time of writing. Pair opened at 0.695 and is trading with a change of 0.42 % .
| Overview | Overview.1 | |
|---|---|---|
| 0 | Today last price | 0.6979 |
| 1 | Today Daily Change | 0.0029 |
| 2 | Today Daily Change % | 0.4200 |
| 3 | Today daily open | 0.6950 |
The pair remains strongly bullish on the daily timeframe. It trades above its 20 SMA @ 0.6807, 50 SMA 0.6749, 100 SMA @ 0.6636 and 200 SMA @ 0.6829.
| Trends | Trends.1 | |
|---|---|---|
| 0 | Daily SMA20 | 0.6807 |
| 1 | Daily SMA50 | 0.6749 |
| 2 | Daily SMA100 | 0.6636 |
| 3 | Daily SMA200 | 0.6829 |
The previous day high was 0.7019 while the previous day low was 0.6941. The daily 38.2% Fib levels comes at 0.6971, expected to provide support. Similarly, the daily 61.8% fib level is at 0.6989, expected to provide resistance.
Note the levels of interest below:
- Pivot support is noted at 0.6921, 0.6892, 0.6843
- Pivot resistance is noted at 0.6999, 0.7048, 0.7077
| Levels | Levels.1 |
|---|---|
| Previous Daily High | 0.7019 |
| Previous Daily Low | 0.6941 |
| Previous Weekly High | 0.6994 |
| Previous Weekly Low | 0.6860 |
| Previous Monthly High | 0.6893 |
| Previous Monthly Low | 0.6629 |
| Daily Fibonacci 38.2% | 0.6971 |
| Daily Fibonacci 61.8% | 0.6989 |
| Daily Pivot Point S1 | 0.6921 |
| Daily Pivot Point S2 | 0.6892 |
| Daily Pivot Point S3 | 0.6843 |
| Daily Pivot Point R1 | 0.6999 |
| Daily Pivot Point R2 | 0.7048 |
| Daily Pivot Point R3 | 0.7077 |
[/s2If]
Join Our Telegram Group
")


