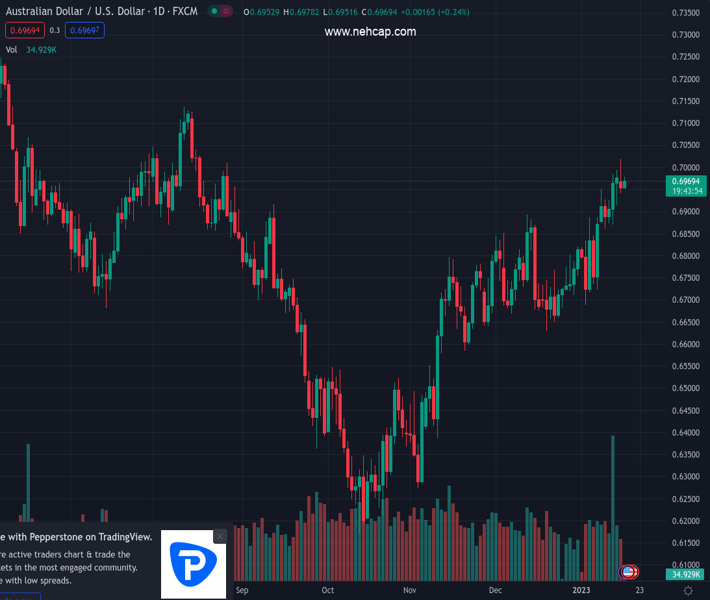
#AUDUSD @ 0.69713 takes the bids to refresh intraday high on strong data from Australia’s biggest customer. (Pivot Orderbook analysis)
…
This is a premium post.
[s2If !current_user_can(access_s2member_level4)]Please register for PREMIUM VERSION HERE to read full post below containing analysis. In case of any error or you think you are not able to read the full post below, please email us at support#nehcap.com [lwa][/s2If] [s2If current_user_can(access_s2member_level4)]
- AUD/USD takes the bids to refresh intraday high on strong data from Australia’s biggest customer.
- China Q4 GDP improved to 2.9%, Industrial Production and Retail Sales also mark better-than-forecast figures for December.
- Risk profile remains unclear even as full markets return, yields dwindle but stock futures print mild losses.
- Recently mixed US data, cautious mood ahead of Aussie jobs report, US Retail Sales probe AUD/USD traders.
The pair currently trades last at 0.69713.
The previous day high was 0.7019 while the previous day low was 0.6941. The daily 38.2% Fib levels comes at 0.6971, expected to provide support. Similarly, the daily 61.8% fib level is at 0.6989, expected to provide resistance.
AUD/USD renews its intraday high around 0.6980 as firmer statistics from China joins the US Dollar retreat during early Tuesday. The Aussie pair buyers, however, remain cautious ahead of this week’s US Retail Sales and Australian employment data amid mixed sentiment.
That said, China’s Gross Domestic Product (GDP) for the fourth quarter (Q4) printed 0.0% QoQ figure versus -0.8% expected and 3.9% prior. Further details suggest that the Industrial Production for December grew 1.3% YoY versus 0.5% market forecasts and 2.2% prior readings. Additionally, Retail Sales improved to -1.8% YoY for December compared to -7.8% consensus and -5.9% prior. Earlier in the day, Australia Westpac Consumer Confidence for January rose to 5.0% from 3.0% prior.
Also read: Breaking: China’s Q4 GDP expands 2.9% YoY vs. 1.8% expected
It should be noted that the return of full markets restores bearish bias for the US Dollar, after portraying a corrective bounce the previous day, as the US Treasury yields fade the week-start rebound. Even so, the market’s risk appetite remains unclear as the S&P 500 Futures print mild losses as it retreats from the monthly high.
Having seen the initial market reaction of the China dump, AUD/USD traders may pay attention to the aforementioned risk catalysts and the second-tier US data like NY Empire State Manufacturing Index for January expected -4.5 versus -11.2 prior. However, major attention will be given to Wednesday’s US Retail Sales for December, expected 0.1% YoY versus -0.6% prior, as well as Australian employment data for the said month.
Considering the recently positive Aussie numbers, in contrast to the mixed US data, the AUD/USD pair is likely to witness further upside unless the scheduled key statistics disappoint the bulls.
The AUD/USD pair’s U-turn from a two-month-old ascending resistance line, close to 0.7025 at the latest, joins nearly overbought conditions of the RSI (14) to tease the Aussie pair sellers. It’s worth noting, however, that, a daily closing below the 200-DMA, around 0.6825 by the press time, becomes necessary for the Aussie bears to retake control.
Technical Levels: Supports and Resistances
AUDUSD currently trading at 0.6968 at the time of writing. Pair opened at 0.695 and is trading with a change of 0.26% % .
| Overview | Overview.1 | |
|---|---|---|
| 0 | Today last price | 0.6968 |
| 1 | Today Daily Change | 0.0018 |
| 2 | Today Daily Change % | 0.26% |
| 3 | Today daily open | 0.695 |
The pair remains strongly bullish on the daily timeframe. It trades above its 20 SMA @ 0.6807, 50 SMA 0.6749, 100 SMA @ 0.6636 and 200 SMA @ 0.6829.
| Trends | Trends.1 | |
|---|---|---|
| 0 | Daily SMA20 | 0.6807 |
| 1 | Daily SMA50 | 0.6749 |
| 2 | Daily SMA100 | 0.6636 |
| 3 | Daily SMA200 | 0.6829 |
The previous day high was 0.7019 while the previous day low was 0.6941. The daily 38.2% Fib levels comes at 0.6971, expected to provide support. Similarly, the daily 61.8% fib level is at 0.6989, expected to provide resistance.
Note the levels of interest below:
- Pivot support is noted at 0.6921, 0.6892, 0.6843
- Pivot resistance is noted at 0.6999, 0.7048, 0.7077
| Levels | Levels.1 |
|---|---|
| Previous Daily High | 0.7019 |
| Previous Daily Low | 0.6941 |
| Previous Weekly High | 0.6994 |
| Previous Weekly Low | 0.6860 |
| Previous Monthly High | 0.6893 |
| Previous Monthly Low | 0.6629 |
| Daily Fibonacci 38.2% | 0.6971 |
| Daily Fibonacci 61.8% | 0.6989 |
| Daily Pivot Point S1 | 0.6921 |
| Daily Pivot Point S2 | 0.6892 |
| Daily Pivot Point S3 | 0.6843 |
| Daily Pivot Point R1 | 0.6999 |
| Daily Pivot Point R2 | 0.7048 |
| Daily Pivot Point R3 | 0.7077 |
[/s2If]
Join Our Telegram Group
")


