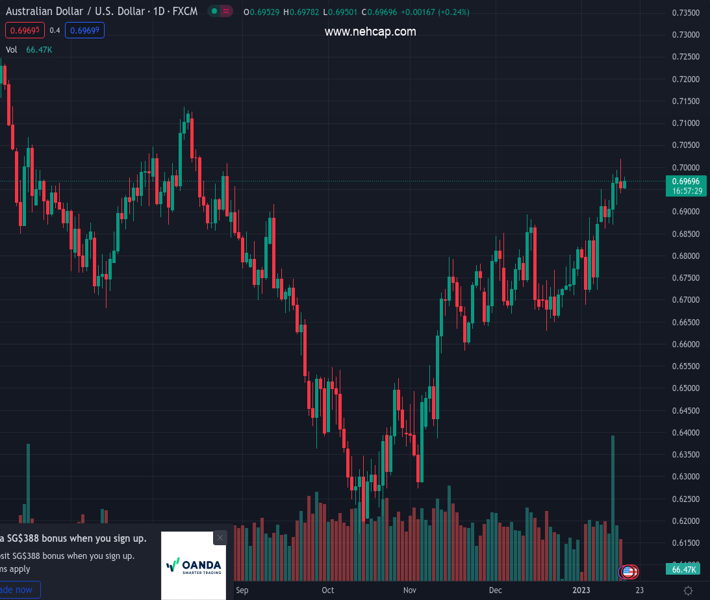
#AUDUSD @ 0.69711 is displaying topsy-turvy moves in a 0.6960-0.6978 range amid caution in the market mood. (Pivot Orderbook analysis)
…
This is a premium post.
[s2If !current_user_can(access_s2member_level4)]Please register for PREMIUM VERSION HERE to read full post below containing analysis. In case of any error or you think you are not able to read the full post below, please email us at support#nehcap.com [lwa][/s2If] [s2If current_user_can(access_s2member_level4)]
- AUD/USD is displaying topsy-turvy moves in a 0.6960-0.6978 range amid caution in the market mood.
- The formation of a Rising Channel indicates an upside trend in a limited territory.
- The Aussie asset has been overlapped by the 20-EMA, which indicates a consolidation added.
The pair currently trades last at 0.69711.
The previous day high was 0.7019 while the previous day low was 0.6941. The daily 38.2% Fib levels comes at 0.6971, expected to provide support. Similarly, the daily 61.8% fib level is at 0.6989, expected to provide resistance.
The AUD/USD pair is displaying topsy-turvy moves in a tad wider range of 0.6960-0.6978 in the Asian session. The Aussie asset has turned sideways following the footprints of the US Dollar Index (DXY). The USD Index is showing a sideways profile amid uncertainty in the market after a stretched weekend.
Also, strengthening US Treasury yields has trimmed investors’ risk appetite. The 10-year US Treasury yields have climbed to near 3.54%. Meanwhile, S&P500 futures are displaying a subdued performance amid caution in the market mood.
AUD/USD is auctioning in a Rising Channel chart pattern on an hourly scale, which signals a continuation of the north-side trend in a marked boundary. On Monday, the Australian Dollar failed to keep the Aussie asset on the escalated levels after a failed breakout.
The asset has been overlapped by the 20-period Exponential Moving Average (EMA) at 0.6964, which indicates a sideways auction ahead.
Also, the Relative Strength Index (RSI) (14) is hovering in the 40.00-60.00 range, which adds to the volatility contraction filters.
A decisive move above Monday’s high at 0.7019 will drive the Aussie towards August high at 0.7137. A break above August high will send the major toward June 9 high around 0.7200.
On the contrary, a downside move below December 29 low at 0.6710 will drag the major further toward December 22 low at 0.6650 followed by November 21 low at 0.6585.
Technical Levels: Supports and Resistances
AUDUSD currently trading at 0.6973 at the time of writing. Pair opened at 0.695 and is trading with a change of 0.33 % .
| Overview | Overview.1 | |
|---|---|---|
| 0 | Today last price | 0.6973 |
| 1 | Today Daily Change | 0.0023 |
| 2 | Today Daily Change % | 0.3300 |
| 3 | Today daily open | 0.6950 |
The pair remains strongly bullish on the daily timeframe. It trades above its 20 SMA @ 0.6807, 50 SMA 0.6749, 100 SMA @ 0.6636 and 200 SMA @ 0.6829.
| Trends | Trends.1 | |
|---|---|---|
| 0 | Daily SMA20 | 0.6807 |
| 1 | Daily SMA50 | 0.6749 |
| 2 | Daily SMA100 | 0.6636 |
| 3 | Daily SMA200 | 0.6829 |
The previous day high was 0.7019 while the previous day low was 0.6941. The daily 38.2% Fib levels comes at 0.6971, expected to provide support. Similarly, the daily 61.8% fib level is at 0.6989, expected to provide resistance.
Note the levels of interest below:
- Pivot support is noted at 0.6921, 0.6892, 0.6843
- Pivot resistance is noted at 0.6999, 0.7048, 0.7077
| Levels | Levels.1 |
|---|---|
| Previous Daily High | 0.7019 |
| Previous Daily Low | 0.6941 |
| Previous Weekly High | 0.6994 |
| Previous Weekly Low | 0.6860 |
| Previous Monthly High | 0.6893 |
| Previous Monthly Low | 0.6629 |
| Daily Fibonacci 38.2% | 0.6971 |
| Daily Fibonacci 61.8% | 0.6989 |
| Daily Pivot Point S1 | 0.6921 |
| Daily Pivot Point S2 | 0.6892 |
| Daily Pivot Point S3 | 0.6843 |
| Daily Pivot Point R1 | 0.6999 |
| Daily Pivot Point R2 | 0.7048 |
| Daily Pivot Point R3 | 0.7077 |
[/s2If]
Join Our Telegram Group
")


