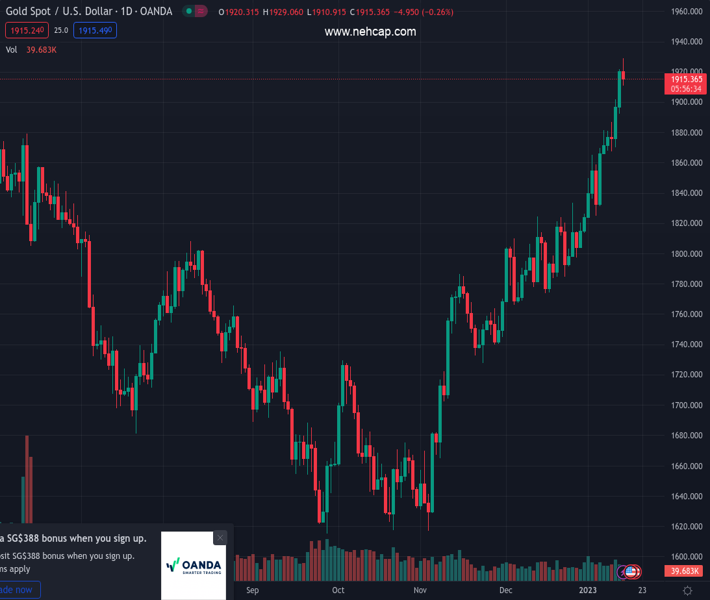
#XAUUSD @ 1,915.38 Gold’s rally stalled shy of reaching $1,930, though it printed a 9-month new high. (Pivot Orderbook analysis)
…
This is a premium post.
[s2If !current_user_can(access_s2member_level4)]Please register for PREMIUM VERSION HERE to read full post below containing analysis. In case of any error or you think you are not able to read the full post below, please email us at support#nehcap.com [lwa][/s2If] [s2If current_user_can(access_s2member_level4)]
- Gold’s rally stalled shy of reaching $1,930, though it printed a 9-month new high.
- Inflation expectations in the United States eased, though Gold’s appeal will likely continue as the US Dollar weakens.
- XAU/USD Price Analysis: Could continue its rally if it reclaims $1,955, opening the door for the $1,980 – $2,000 range.
The pair currently trades last at 1915.38.
The previous day high was 1921.96 while the previous day low was 1892.34. The daily 38.2% Fib levels comes at 1910.65, expected to provide support. Similarly, the daily 61.8% fib level is at 1903.65, expected to provide support.
Gold price retraces as the North American session begins, even though Wall Street would remain closed in observance of Martin Luther King Jr. day. Nevertheless, the US Dollar (USD) has recovered some ground, snapping two straight days of losses, while the 10-year US Treasury bond yield finished the week around 3.50%. At the time of writing, XAU/USD is trading at $1,915.62, with losses of 0.34%.
Global equities are trading negatively. US equity futures remain dealing with losses, while last week’s inflation data in the United States (US) pressured the US dollar. The University of Michigan, Consumer sentiment poll showed that 1-year inflation expectations eased to 4% from 4.4%, while for a 5-year horizon, edged up to 3% from 2.9%. Also, a slew of US Federal Reserve (Fed) officials backed the idea of slowing the pace of interest rate hikes.
In the meantime, the US Dollar Index (DXY), which measures the buck’s value against six currencies, has recovered some ground, up 0.15% at 102.332. With the US markets closed for a holiday, US Treasury bond yields remained unchanged, but traders should be aware that US yields ended on a higher note on Friday.
Ahead of the week, the US economic docket will feature the US Empire State Manufacturing Survey, alongside Fed speaking and the Beige book, as the US Central Bank prepares for the year’s first monetary policy. On Wednesday, US Retail Sales and PPI will get a look, while Initial Jobless Claims and Housing data will be revealed on Thursday.
From a daily chart perspective, Gold remains upward biased, even though the yellow metal spurred an uptick to overbought conditions, per the Relative Strength Index (RSI). The Rate of Change (RoC) flashes that buyers continue to gather momentum, so the current pullback seems to be used by Gold longs, which could be adding to previous positions, as the non-yielding metal printed a new 9-month high at $1,928.95.
XAU/USD resistance levels lie at $1,930, followed by April’s 22 daily high of $1955.60, followed by April 19 high of $1,981.95, ahead of the $2,000 barrier.
Technical Levels: Supports and Resistances
XAUUSD currently trading at 1915.62 at the time of writing. Pair opened at 1920.76 and is trading with a change of -0.27 % .
| Overview | Overview.1 | |
|---|---|---|
| 0 | Today last price | 1915.62 |
| 1 | Today Daily Change | -5.14 |
| 2 | Today Daily Change % | -0.27 |
| 3 | Today daily open | 1920.76 |
The pair remains strongly bullish on the daily timeframe. It trades above its 20 SMA @ 1836.21, 50 SMA 1793.04, 100 SMA @ 1734.08 and 200 SMA @ 1777.12.
| Trends | Trends.1 | |
|---|---|---|
| 0 | Daily SMA20 | 1836.21 |
| 1 | Daily SMA50 | 1793.04 |
| 2 | Daily SMA100 | 1734.08 |
| 3 | Daily SMA200 | 1777.12 |
The previous day high was 1921.96 while the previous day low was 1892.34. The daily 38.2% Fib levels comes at 1910.65, expected to provide support. Similarly, the daily 61.8% fib level is at 1903.65, expected to provide support.
Note the levels of interest below:
- Pivot support is noted at 1901.41, 1882.07, 1871.79
- Pivot resistance is noted at 1931.03, 1941.31, 1960.65
| Levels | Levels.1 |
|---|---|
| Previous Daily High | 1921.96 |
| Previous Daily Low | 1892.34 |
| Previous Weekly High | 1921.96 |
| Previous Weekly Low | 1865.22 |
| Previous Monthly High | 1833.38 |
| Previous Monthly Low | 1765.89 |
| Daily Fibonacci 38.2% | 1910.65 |
| Daily Fibonacci 61.8% | 1903.65 |
| Daily Pivot Point S1 | 1901.41 |
| Daily Pivot Point S2 | 1882.07 |
| Daily Pivot Point S3 | 1871.79 |
| Daily Pivot Point R1 | 1931.03 |
| Daily Pivot Point R2 | 1941.31 |
| Daily Pivot Point R3 | 1960.65 |
[/s2If]
Join Our Telegram Group
")


