#XAUUSD @ 1,914.32 Gold price retreats from multi-month high as bulls take a breather after two-day uptrend., @nehcap view: Pullback expected (Pivot Orderbook analysis)
…
This is a premium post.
[s2If !current_user_can(access_s2member_level4)]Please register for PREMIUM VERSION HERE to read full post below containing analysis. In case of any error or you think you are not able to read the full post below, please email us at support#nehcap.com [lwa][/s2If] [s2If current_user_can(access_s2member_level4)]
- Gold price retreats from multi-month high as bulls take a breather after two-day uptrend.
- United States holiday restricts XAU/USD’s downside moves ahead of a busy day.
- US 10-year Treasury bond yields, US Dollar Index recovered amid mixed clues.
- China Gross Domestic Product for Q4 will give immediate directions to Gold, clues for Federal Reserve’s next move are crucial.
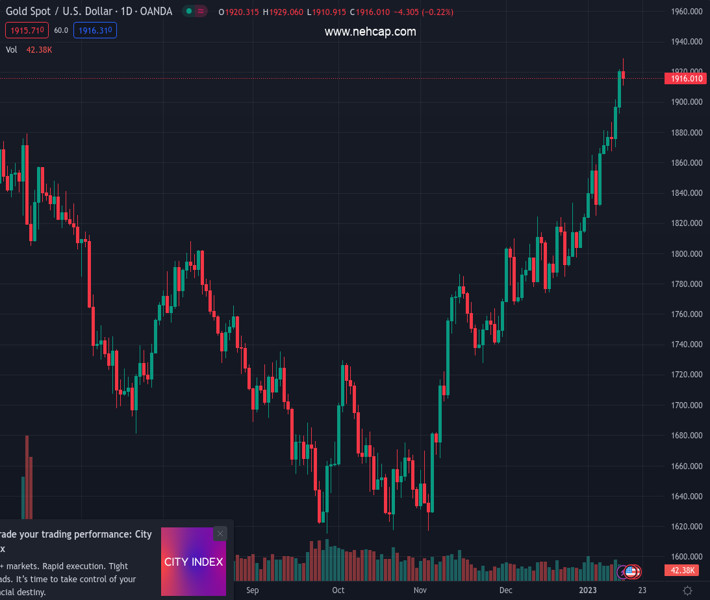
The pair currently trades last at 1914.32.
The previous day high was 1921.96 while the previous day low was 1892.34. The daily 38.2% Fib levels comes at 1910.65, expected to provide support. Similarly, the daily 61.8% fib level is at 1903.65, expected to provide support.
Gold price (XAU/USD) marks a softer landing after rising to the highest levels since April 2022 in the last week. That said, the yellow metal printed the first daily loss in three amid a sluggish start to the week as markets in the United States were closed due to Martin Luther King’s Birthday. Even so, the US Treasury bond yields triggered the much-awaited rebound in the US Dollar and probed the XAU/USD bulls as traders have mixed feeling about the Federal Reserve’s (Fed) policy pivot.
US 10-year Treasury bond yields defended the bounce off a five-week low marked the last Friday as traders reassess talks of the United States’ “soft landing” and the Federal Reserve’s policy pivot during a slightly dull start of the week. That said, the benchmark bond coupons ended Monday’s North American trading session with mild gains of around 3.498%. On the same line, the two-year bond yields were floating around 4.22% and hence the yield curve inversion kept flashing the risk of recession. Even so, the concerns that the US could avoid a hard landing and China reopening helped the market sentiment to remain mildly positive and probed the Gold sellers.
The softer prints of the United States Consumer Price Index (CPI) and easing wage growth, together with downbeat services activities, allowed the Federal Reserve (Fed) doves to brace for the driver’s seat. However, Friday’s upbeat prints of the Michigan Consumer Sentiment Index (CSI) and 5-year inflation expectations allowed US Dollar bulls to remain hopeful of further rate hikes from the Fed. Other than the mixed US data, the Federal Reserve (Fed) policymakers’ rejection to praise the market’s dovish outlook also defend the US Dollar buyers, despite marking a multi-day low, which in turn probes the Gold price upside.
China’s reopening boosts Gold prices considering the dragon nation’s stand as the key XAU/USD consumer. However, the lack of easing in Beijing’s Covid numbers and geopolitical tensions with the US, mainly surrounding Taiwan, seems to challenge China-linked optimism in the Gold market. Also likely to probe Beijing-inspired optimism is the cautious mood ahead of today’s China Gross Domestic Product (GDP) for the fourth quarter (Q4), expected -0.8% QoQ versus 3.9% prior.
Gold price remains inside an eight-day-old bullish channel surrounding the highest levels since late April 2022. Even so, the looming bear crossing the Moving Average Convergence and Divergence (MACD) indicator joins the rejections of the short-term bullish trend by the Relative Strength Index (RSI) line, placed at 14, to lure short-term bears.
The nearby bearish trend, however, hinges on the quote’s successful rejection of the bullish channel, by breaking the $1,898 support.
Following that, a three-week-old ascending support line and the 100-SMA, respectively near $1,865 and $1,846, could probe Gold sellers. It’s worth mentioning that the XAU/USD weakness past $1,846 needs validation from a one-month-old horizontal support zone, close to $1,825.
On the contrary, the $1,930 round figure acts as an immediate upside hurdle for the Gold price to cross before regaining the buyer’s attention.
Even so, the aforementioned channel’s top line, near $1,936, appears the last defense for the XAU/USD bears, a break of which could propel Gold price toward the April 2022 peak surrounding $1,998.
Trend: Pullback expected
Technical Levels: Supports and Resistances
XAUUSD currently trading at 1914.43 at the time of writing. Pair opened at 1920.76 and is trading with a change of -0.33 % .
| Overview | Overview.1 | |
|---|---|---|
| 0 | Today last price | 1914.43 |
| 1 | Today Daily Change | -6.33 |
| 2 | Today Daily Change % | -0.33 |
| 3 | Today daily open | 1920.76 |
The pair remains strongly bullish on the daily timeframe. It trades above its 20 SMA @ 1836.21, 50 SMA 1793.04, 100 SMA @ 1734.08 and 200 SMA @ 1777.12.
| Trends | Trends.1 | |
|---|---|---|
| 0 | Daily SMA20 | 1836.21 |
| 1 | Daily SMA50 | 1793.04 |
| 2 | Daily SMA100 | 1734.08 |
| 3 | Daily SMA200 | 1777.12 |
The previous day high was 1921.96 while the previous day low was 1892.34. The daily 38.2% Fib levels comes at 1910.65, expected to provide support. Similarly, the daily 61.8% fib level is at 1903.65, expected to provide support.
Note the levels of interest below:
- Pivot support is noted at 1901.41, 1882.07, 1871.79
- Pivot resistance is noted at 1931.03, 1941.31, 1960.65
| Levels | Levels.1 |
|---|---|
| Previous Daily High | 1921.96 |
| Previous Daily Low | 1892.34 |
| Previous Weekly High | 1921.96 |
| Previous Weekly Low | 1865.22 |
| Previous Monthly High | 1833.38 |
| Previous Monthly Low | 1765.89 |
| Daily Fibonacci 38.2% | 1910.65 |
| Daily Fibonacci 61.8% | 1903.65 |
| Daily Pivot Point S1 | 1901.41 |
| Daily Pivot Point S2 | 1882.07 |
| Daily Pivot Point S3 | 1871.79 |
| Daily Pivot Point R1 | 1931.03 |
| Daily Pivot Point R2 | 1941.31 |
| Daily Pivot Point R3 | 1960.65 |
[/s2If]
Join Our Telegram Group
")


