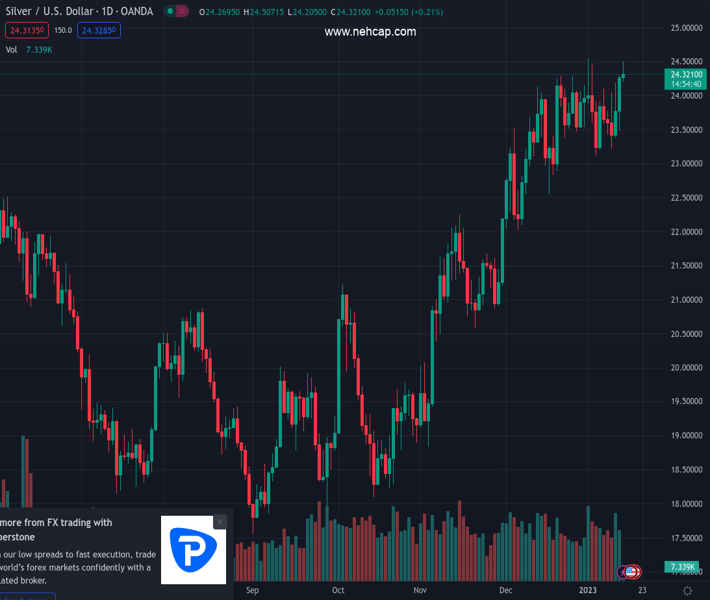
#XAGUSD @ 24.322 Silver edges higher for the third straight day and inches back closer to the multi-month top. (Pivot Orderbook analysis)
…
This is a premium post.
[s2If !current_user_can(access_s2member_level4)]Please register for PREMIUM VERSION HERE to read full post below containing analysis. In case of any error or you think you are not able to read the full post below, please email us at support#nehcap.com [lwa][/s2If] [s2If current_user_can(access_s2member_level4)]
- Silver edges higher for the third straight day and inches back closer to the multi-month top.
- The set-up favours bulls and supports prospects for an extension of the appreciating move.
- A convincing break below the $23.00 mark is needed to negate the near-term positive bias.
The pair currently trades last at 24.322.
The previous day high was 24.3 while the previous day low was 23.5. The daily 38.2% Fib levels comes at 23.99, expected to provide support. Similarly, the daily 61.8% fib level is at 23.8, expected to provide support.
Silver prolongs the positive trend for the third straight day on Monday and steadily climbs back closer to its highest level since April 22 touched earlier this month. The white metal sticks to its intraday gains heading into the European session, with bulls now awaiting a move beyond the $24.50-$24.55 area before placing fresh bets.
From a technical perspective, last week’s bounce from the vicinity of the 200-period SMA on the 4-hour chart and a sustained strength above the $24.00 mark was seen as a fresh trigger for bullish traders. Furthermore, oscillators on the daily chart are holding comfortably in the positive territory and are still far from being in the overbought zone. This, in turn, supports prospects for an extension of the appreciating move.
That said, RSI (14) on hourly charts hovers around the 70 mark (representing overbought conditions) and warrants some caution. Nevertheless, the stage still seems set for an eventual breakout through the $24.50-$24.55 region and a subsequent move towards reclaiming the $25.00 psychological mark for the first time since April 2022. Some follow-through buying has the potential to lift the XAG/USD to the $25.35-$25.40 hurdle.
On the flip side, the $24.10-$24.00 resistance breakpoint now seems to protect the immediate downside. Any further pullback is more likely to attract fresh buyers and remain limited near the 200-SMA on the 4-hour chart, currently around the $23.30-$23.25 area. This is followed by the $23.00 round figure, which if broken decisively will negate the positive outlook and shift the near-term bias in favour of bearish traders.
The XAG/USD might then accelerate the fall towards the $22.60-$22.55 region and weaken further towards the next relevant support near the $22.10-$22.00 zone.
Technical Levels: Supports and Resistances
XAGUSD currently trading at 24.35 at the time of writing. Pair opened at 24.27 and is trading with a change of 0.33 % .
| Overview | Overview.1 | |
|---|---|---|
| 0 | Today last price | 24.35 |
| 1 | Today Daily Change | 0.08 |
| 2 | Today Daily Change % | 0.33 |
| 3 | Today daily open | 24.27 |
The pair remains strongly bullish on the daily timeframe. It trades above its 20 SMA @ 23.75, 50 SMA 22.72, 100 SMA @ 20.94 and 200 SMA @ 21.08.
| Trends | Trends.1 | |
|---|---|---|
| 0 | Daily SMA20 | 23.75 |
| 1 | Daily SMA50 | 22.72 |
| 2 | Daily SMA100 | 20.94 |
| 3 | Daily SMA200 | 21.08 |
The previous day high was 24.3 while the previous day low was 23.5. The daily 38.2% Fib levels comes at 23.99, expected to provide support. Similarly, the daily 61.8% fib level is at 23.8, expected to provide support.
Note the levels of interest below:
- Pivot support is noted at 23.75, 23.22, 22.95
- Pivot resistance is noted at 24.54, 24.82, 25.34
| Levels | Levels.1 |
|---|---|
| Previous Daily High | 24.30 |
| Previous Daily Low | 23.50 |
| Previous Weekly High | 24.30 |
| Previous Weekly Low | 23.22 |
| Previous Monthly High | 24.30 |
| Previous Monthly Low | 22.03 |
| Daily Fibonacci 38.2% | 23.99 |
| Daily Fibonacci 61.8% | 23.80 |
| Daily Pivot Point S1 | 23.75 |
| Daily Pivot Point S2 | 23.22 |
| Daily Pivot Point S3 | 22.95 |
| Daily Pivot Point R1 | 24.54 |
| Daily Pivot Point R2 | 24.82 |
| Daily Pivot Point R3 | 25.34 |
[/s2If]
Join Our Telegram Group
")


