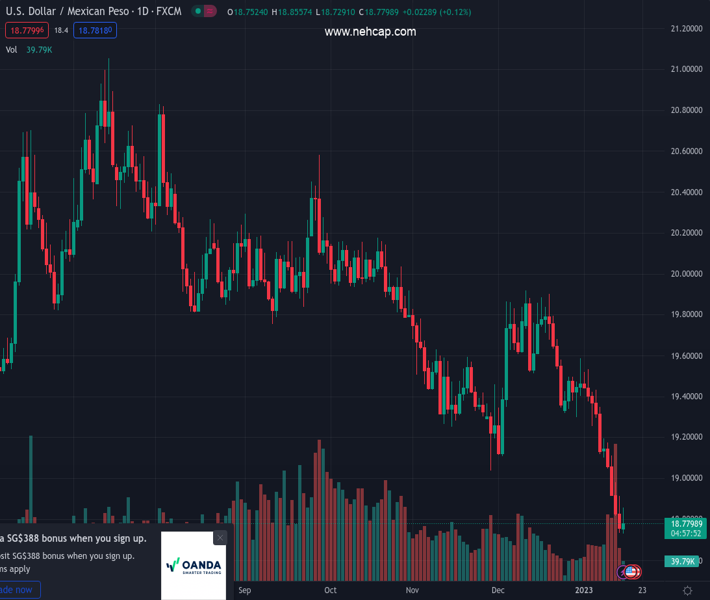
#USDMXN @ 18.7815 Mexican Peso holds bullish tone against the US Dollar. (Pivot Orderbook analysis)
…
This is a premium post.
[s2If !current_user_can(access_s2member_level4)]Please register for PREMIUM VERSION HERE to read full post below containing analysis. In case of any error or you think you are not able to read the full post below, please email us at support#nehcap.com [lwa][/s2If] [s2If current_user_can(access_s2member_level4)]
- Mexican Peso holds bullish tone against the US Dollar.
- USD/MXN’s technical indicators point to a correction or a consolidation.
- Consolidation below 18.70 would open the doors to 18.50.
The pair currently trades last at 18.7815.
The previous day high was 18.9153 while the previous day low was 18.7331. The daily 38.2% Fib levels comes at 18.8027, expected to provide resistance. Similarly, the daily 61.8% fib level is at 18.8457, expected to provide resistance.
The USD/MXN is rising on Monday after hitting the lowest intraday level in almost three years at 18.73. A weaker US Dollar and a positive tone across financial markets are offering support the Mexican Peso and emerging market currencies.
The rebound on Monday was capped by the 18.85 zone, the confluence of a horizontal level, the 20-Simple Moving Average in four hours chart and a downtrend line. A break above would open the doors to a deeper bullish correction in line with some technical indicators. The next resistance is seen at 18.90 before the more important zone of 19.00/05 which should limit the upside.
In the short-term, technical indicators favor a stabilization. Momentum is well below midlines but pointing to the upside. RSI is at or near oversold levels and MACD shows some potential for a deeper correction.
The main trend for USD/MXN is bearish. The downside so far has found support at the 18.70/75 zone. A break lower would clear the way to more losses, targeting the 18.50 zone.
Technical Levels: Supports and Resistances
USDMXN currently trading at 18.7956 at the time of writing. Pair opened at 18.7681 and is trading with a change of 0.15 % .
| Overview | Overview.1 | |
|---|---|---|
| 0 | Today last price | 18.7956 |
| 1 | Today Daily Change | 0.0275 |
| 2 | Today Daily Change % | 0.1500 |
| 3 | Today daily open | 18.7681 |
The pair remains strongly bearish on the daily time frame. It trades below the 20 SMA @ 19.3434, 50 SMA 19.4344, 100 SMA @ 19.7159 and 200 SMA @ 19.9367.
| Trends | Trends.1 | |
|---|---|---|
| 0 | Daily SMA20 | 19.3434 |
| 1 | Daily SMA50 | 19.4344 |
| 2 | Daily SMA100 | 19.7159 |
| 3 | Daily SMA200 | 19.9367 |
The previous day high was 18.9153 while the previous day low was 18.7331. The daily 38.2% Fib levels comes at 18.8027, expected to provide resistance. Similarly, the daily 61.8% fib level is at 18.8457, expected to provide resistance.
Note the levels of interest below:
- Pivot support is noted at 18.6957, 18.6234, 18.5136
- Pivot resistance is noted at 18.8779, 18.9876, 19.06
| Levels | Levels.1 |
|---|---|
| Previous Daily High | 18.9153 |
| Previous Daily Low | 18.7331 |
| Previous Weekly High | 19.1951 |
| Previous Weekly Low | 18.7331 |
| Previous Monthly High | 19.9181 |
| Previous Monthly Low | 19.1084 |
| Daily Fibonacci 38.2% | 18.8027 |
| Daily Fibonacci 61.8% | 18.8457 |
| Daily Pivot Point S1 | 18.6957 |
| Daily Pivot Point S2 | 18.6234 |
| Daily Pivot Point S3 | 18.5136 |
| Daily Pivot Point R1 | 18.8779 |
| Daily Pivot Point R2 | 18.9876 |
| Daily Pivot Point R3 | 19.0600 |
[/s2If]
Join Our Telegram Group
")


