#USDJPY @ 127.601 has sensed buying interest after dropping to near 127.20. (Pivot Orderbook analysis)
…
This is a premium post.
[s2If !current_user_can(access_s2member_level4)]Please register for PREMIUM VERSION HERE to read full post below containing analysis. In case of any error or you think you are not able to read the full post below, please email us at support#nehcap.com [lwa][/s2If] [s2If current_user_can(access_s2member_level4)]
- USD/JPY has sensed buying interest after dropping to near 127.20.
- The USD Index has recovered to near 101.60 despite the upbeat market mood.
- Downward-sloping 20-and 50-EMAs indicate more weakness ahead.
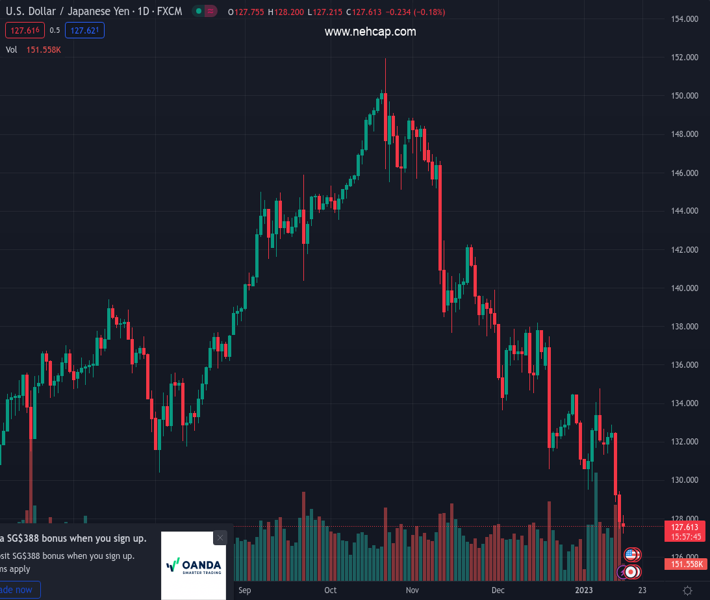
The pair currently trades last at 127.601.
The previous day high was 129.43 while the previous day low was 127.46. The daily 38.2% Fib levels comes at 128.21, expected to provide resistance. Similarly, the daily 61.8% fib level is at 128.68, expected to provide resistance.
The USD/JPY pair has retreated after sensing buying interest around 127.20 in the early European session. The asset has followed the footprints of the US Dollar Index (DXY) and has attempted a recovery. The USD Index has recovered to near 101.60 despite the upbeat market mood, which could result in a resumption of the downside journey.
Meanwhile, the Japanese Yen bulls are likely to dance to the tunes of the Bank of Japan (BOJ) monetary policy, which is scheduled to be announced on Wednesday. The commentary from BOJ Haruhiko Kuroda will be keenly watched amid soaring chatters bout an exit from a decade-long ultra-loose monetary policy.
USD/JPY is declining towards the horizontal support plotted from May 24 low at 126.36 on a daily scale. Downward-sloping 20-and 50-period Exponential Moving Averages (EMAs) at 132.10 and 135.36 respectively, add to the downside filters.
The Relative Strength Index (RSI) (14) is oscillating in the bearish range of 20.00-40.00, showing no signs of divergence and oversold, which might result in further weakness in the US Dollar.
Going ahead, USD/JPY needs to drop below Monday’s low at 127.22, which will expose the asset for more downside towards the horizontal support plotted from May 24 low at 126.36. A slippage below the latter will open room for further downside toward the psychological support at 125.00.
On the flip side, a decisive move above December 20 low at 130.57 will drive the asset toward January 9 low at 131.31 followed by January 12 high at 132.56.
Technical Levels: Supports and Resistances
USDJPY currently trading at 127.74 at the time of writing. Pair opened at 127.89 and is trading with a change of -0.12 % .
| Overview | Overview.1 | |
|---|---|---|
| 0 | Today last price | 127.74 |
| 1 | Today Daily Change | -0.15 |
| 2 | Today Daily Change % | -0.12 |
| 3 | Today daily open | 127.89 |
The pair remains strongly bearish on the daily time frame. It trades below the 20 SMA @ 132.25, 50 SMA 136.3, 100 SMA @ 140.63 and 200 SMA @ 136.64.
| Trends | Trends.1 | |
|---|---|---|
| 0 | Daily SMA20 | 132.25 |
| 1 | Daily SMA50 | 136.30 |
| 2 | Daily SMA100 | 140.63 |
| 3 | Daily SMA200 | 136.64 |
The previous day high was 129.43 while the previous day low was 127.46. The daily 38.2% Fib levels comes at 128.21, expected to provide resistance. Similarly, the daily 61.8% fib level is at 128.68, expected to provide resistance.
Note the levels of interest below:
- Pivot support is noted at 127.09, 126.29, 125.12
- Pivot resistance is noted at 129.06, 130.23, 131.03
| Levels | Levels.1 |
|---|---|
| Previous Daily High | 129.43 |
| Previous Daily Low | 127.46 |
| Previous Weekly High | 132.87 |
| Previous Weekly Low | 127.46 |
| Previous Monthly High | 138.18 |
| Previous Monthly Low | 130.57 |
| Daily Fibonacci 38.2% | 128.21 |
| Daily Fibonacci 61.8% | 128.68 |
| Daily Pivot Point S1 | 127.09 |
| Daily Pivot Point S2 | 126.29 |
| Daily Pivot Point S3 | 125.12 |
| Daily Pivot Point R1 | 129.06 |
| Daily Pivot Point R2 | 130.23 |
| Daily Pivot Point R3 | 131.03 |
[/s2If]
Join Our Telegram Group
")


