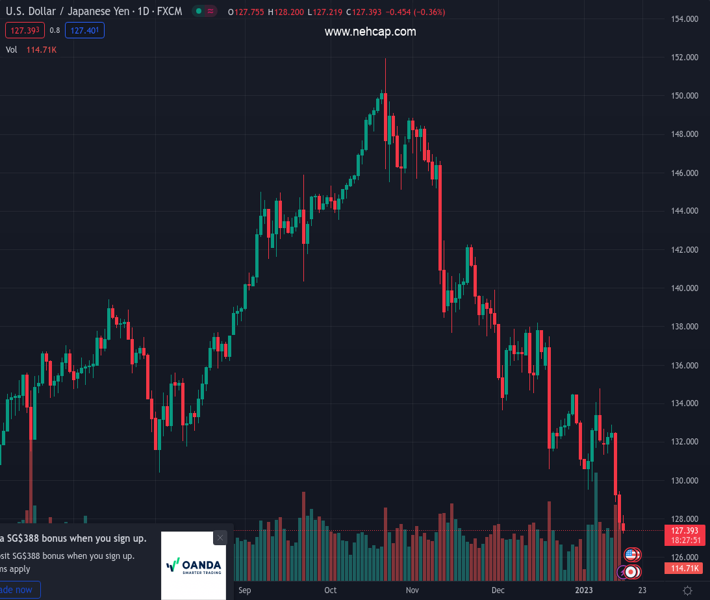
#USDJPY @ 127.403 is at fresh eight-month lows, 127.00 appears at risk. (Pivot Orderbook analysis)
…
This is a premium post.
[s2If !current_user_can(access_s2member_level4)]Please register for PREMIUM VERSION HERE to read full post below containing analysis. In case of any error or you think you are not able to read the full post below, please email us at support#nehcap.com [lwa][/s2If] [s2If current_user_can(access_s2member_level4)]
- USD/JPY is at fresh eight-month lows, 127.00 appears at risk.
- Japanese yen rallies on potential hawkish BoJ action, as yields policy stutters.
- US holiday-induced thin trading exaggerates moves in the USD/JPY pair.
The pair currently trades last at 127.403.
The previous day high was 129.43 while the previous day low was 127.46. The daily 38.2% Fib levels comes at 128.21, expected to provide resistance. Similarly, the daily 61.8% fib level is at 128.68, expected to provide resistance.
USD/JPY is holding the latest downtick below 127.50, having renewed eight-month lows at 127.24. Bears remain in control at the start of the week on Monday, as the Japanese Yen extends its bullish momentum.
Hopes that the Bank of Japan (BoJ) could surprise markets with a hawkish pivot at its policy meeting this week are underpinning the sentiment around the Yen, especially after the Japanese central bank failed to defend its yield curve control (YCC) policy for the second day in a row. The 10-year JGB yield rose 1 basis point to 0.510%, topping the 0.5% ceiling of the BOJ’s policy band.
“The BOJ bought roughly 10 trillion Yen ($78 billion) in JGBs over the past two days, with a 5 trillion Yen purchase on Friday topping the high it had just set Thursday and is preparing to purchase more Japanese government bonds on Monday,” FXStreet’s Analyst Ross Burland noted, citing the Nikkei Asian Review.
Meanwhile, the renewed sell-off in the USD/JPY pair is dragging the US Dollar broadly lower, with the US Dollar Index down 0.36% on the day at 101.84, at the press time. The US market is closed on Monday, in observance of Martin Luther King Jr. Day, and therefore low liquidity is exaggerating the moves in the major.
The key event risk for the spot this week remains the BoJ monetary policy announcements and the US Retail Sales data. In a surprise move last month, the BoJ widened the band for the 10-year bond yield to 0.5% up and down from its 0% target.
Technical Levels: Supports and Resistances
USDJPY currently trading at 127.41 at the time of writing. Pair opened at 127.89 and is trading with a change of -0.34 % .
| Overview | Overview.1 | |
|---|---|---|
| 0 | Today last price | 127.41 |
| 1 | Today Daily Change | -0.43 |
| 2 | Today Daily Change % | -0.34 |
| 3 | Today daily open | 127.89 |
The pair remains strongly bearish on the daily time frame. It trades below the 20 SMA @ 132.25, 50 SMA 136.3, 100 SMA @ 140.63 and 200 SMA @ 136.64.
| Trends | Trends.1 | |
|---|---|---|
| 0 | Daily SMA20 | 132.25 |
| 1 | Daily SMA50 | 136.30 |
| 2 | Daily SMA100 | 140.63 |
| 3 | Daily SMA200 | 136.64 |
The previous day high was 129.43 while the previous day low was 127.46. The daily 38.2% Fib levels comes at 128.21, expected to provide resistance. Similarly, the daily 61.8% fib level is at 128.68, expected to provide resistance.
Note the levels of interest below:
- Pivot support is noted at 127.09, 126.29, 125.12
- Pivot resistance is noted at 129.06, 130.23, 131.03
| Levels | Levels.1 |
|---|---|
| Previous Daily High | 129.43 |
| Previous Daily Low | 127.46 |
| Previous Weekly High | 132.87 |
| Previous Weekly Low | 127.46 |
| Previous Monthly High | 138.18 |
| Previous Monthly Low | 130.57 |
| Daily Fibonacci 38.2% | 128.21 |
| Daily Fibonacci 61.8% | 128.68 |
| Daily Pivot Point S1 | 127.09 |
| Daily Pivot Point S2 | 126.29 |
| Daily Pivot Point S3 | 125.12 |
| Daily Pivot Point R1 | 129.06 |
| Daily Pivot Point R2 | 130.23 |
| Daily Pivot Point R3 | 131.03 |
[/s2If]
Join Our Telegram Group
")


