The oil price has corrected after failing to sustain above the crucial resistance of $80.00. (Pivot Orderbook analysis)
…
This is a premium post.
[s2If !current_user_can(access_s2member_level4)]Please register for PREMIUM VERSION HERE to read full post below containing analysis. In case of any error or you think you are not able to read the full post below, please email us at support#nehcap.com [lwa][/s2If] [s2If current_user_can(access_s2member_level4)]
- The oil price has corrected after failing to sustain above the crucial resistance of $80.00.
- A Symmetrical Triangle formation is indicating volatility contraction in oil price.
- A recovery move in the oil price has pushed it above the 20-and 50-EMAs firmly.
The pair currently trades last at 79.49.
The previous day high was 80.25 while the previous day low was 78.22. The daily 38.2% Fib levels comes at 79.47, expected to provide support. Similarly, the daily 61.8% fib level is at 78.99, expected to provide support.
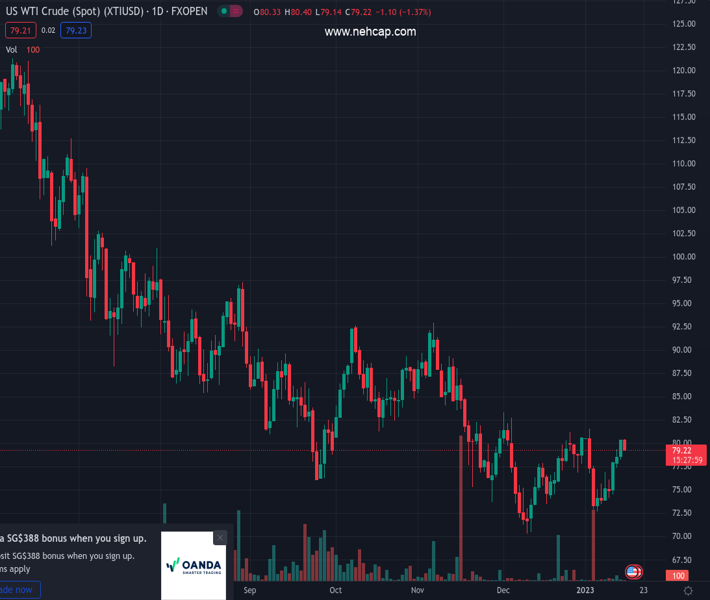
West Texas Intermediate (WTI), futures on NYMEX, have failed to sustain above the crucial resistance of $80.00 in the Asian session. The oil price has corrected and dropped to near $79.46 after a firmer rally despite an upbeat market mood.
Meanwhile, selling pressure in the oil price is also backed by a recovery in the US Dollar Index (DXY). The USD Index has recovered after dropping to near 101.40 and is struggling to extend its upside journey above 101.60.
The black gold is displaying a Symmetrical Triangle chart pattern on a daily scale that indicates volatility contraction. The upward-sloping trendline of the chart pattern is placed from December 9 low at $70.27 while the downward-sloping trendline is placed from December 5 high at $82.74. The aforementioned chart pattern is a neutral triangle and results in wider ticks and heavy volume after an explosion.
A recovery move in the oil price has pushed it above the 20-and 50-period Exponential Moving Averages (EMAs) at $77.57 and $79.00, which adds to the upside filters.
The Relative Strength Index (RSI) (14) is oscillating in a 40.00-60.00 range, which indicates that investors are awaiting the release of any potential trigger for fresh cues.
For an upside move, the oil price needs to break above the January 3 high at $81.56, which will drive the asset toward December 1 high at $83.30 followed by November 17 high around $85.00.
Alternatively, a break below January 5 low at $72.64 will drag the oil price toward December 9 low at $70.27. The asset would be exposed for more downside to near 14 December 2021 low at $69.32 after surrendering the support at December 9 low at $70.27.
Technical Levels: Supports and Resistances
XTIUSD currently trading at 79.49 at the time of writing. Pair opened at 80.19 and is trading with a change of -0.87 % .
| Overview | Overview.1 | |
|---|---|---|
| 0 | Today last price | 79.49 |
| 1 | Today Daily Change | -0.70 |
| 2 | Today Daily Change % | -0.87 |
| 3 | Today daily open | 80.19 |
The pair is trading above its 20 Daily moving average @ 77.55, above its 50 Daily moving average @ 78.84 , below its 100 Daily moving average @ 82.31 and below its 200 Daily moving average @ 92.47
| Trends | Trends.1 | |
|---|---|---|
| 0 | Daily SMA20 | 77.55 |
| 1 | Daily SMA50 | 78.84 |
| 2 | Daily SMA100 | 82.31 |
| 3 | Daily SMA200 | 92.47 |
The previous day high was 80.25 while the previous day low was 78.22. The daily 38.2% Fib levels comes at 79.47, expected to provide support. Similarly, the daily 61.8% fib level is at 78.99, expected to provide support.
Note the levels of interest below:
- Pivot support is noted at 78.86, 77.53, 76.83
- Pivot resistance is noted at 80.88, 81.58, 82.91
| Levels | Levels.1 |
|---|---|
| Previous Daily High | 80.25 |
| Previous Daily Low | 78.22 |
| Previous Weekly High | 80.25 |
| Previous Weekly Low | 73.89 |
| Previous Monthly High | 83.30 |
| Previous Monthly Low | 70.27 |
| Daily Fibonacci 38.2% | 79.47 |
| Daily Fibonacci 61.8% | 78.99 |
| Daily Pivot Point S1 | 78.86 |
| Daily Pivot Point S2 | 77.53 |
| Daily Pivot Point S3 | 76.83 |
| Daily Pivot Point R1 | 80.88 |
| Daily Pivot Point R2 | 81.58 |
| Daily Pivot Point R3 | 82.91 |
[/s2If]
Join Our Telegram Group
")


