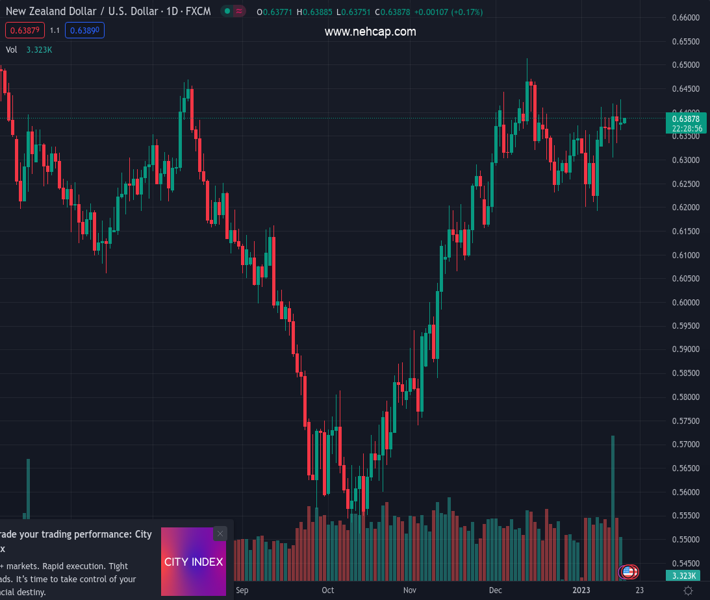
#NZDUSD @ 0.63867 struggles to defend bulls inside one-week-old ascending triangle., @nehcap view: Further downside expected (Pivot Orderbook analysis)
…
This is a premium post.
[s2If !current_user_can(access_s2member_level4)]Please register for PREMIUM VERSION HERE to read full post below containing analysis. In case of any error or you think you are not able to read the full post below, please email us at support#nehcap.com [lwa][/s2If] [s2If current_user_can(access_s2member_level4)]
- NZD/USD struggles to defend bulls inside one-week-old ascending triangle.
- 200-SMA, previous resistance from mid-December adds to the downside filters.
- RSI retreat, sluggish MACD lures bears amid dull markets.
The pair currently trades last at 0.63867.
The previous day high was 0.6417 while the previous day low was 0.6335. The daily 38.2% Fib levels comes at 0.6366, expected to provide support. Similarly, the daily 61.8% fib level is at 0.6385, expected to provide support.
NZD/USD stays defensive around 0.6390, following a retreat from multi-day high, as traders await the key China Gross Domestic Product (GDP) for the fourth quarter (Q4) during early Tuesday. Also likely to have probed the Kiwi pair buyers are recently released downbeat quarterly economic forecasts by the New Zealand Institute of Economic Research (NZIER).
Also read: NZIER QSBO: New Zealand business confidence at lowest since 1974
That said, the quote pokes the support line of the weekly ascending triangle, close to 0.6375 by the press time, amid mildly bearish MACD signals and the RSI (14) weakness.
With this, the NZD/USD prices are likely to break the immediate support surrounding 0.6375. However, the 200-Simple Moving Average (SMA) level surrounding 0.6345 appears crucial for the bears.
Following that, the resistance-turned-support line from December 13, 2022, around 0.6265 at the latest, could challenge the Kiwi bears before giving them control.
On the flip side, the aforementioned triangle’s top line, close to 0.6425 by the press time, restricts the short-term NZD/USD upside.
Should the Kiwi pair buyers defy the triangle formation and keep the reins past 0.6425, the 0.6500 round figure and previous monthly peak near 0.6515 could challenge the quote’s upside momentum.
Overall, NZD/USD pair is likely to witness further weakness but the rejection of the bullish trend is yet absent from the radar.
Trend: Further downside expected
Technical Levels: Supports and Resistances
NZDUSD currently trading at 0.6385 at the time of writing. Pair opened at 0.6387 and is trading with a change of -0.03% % .
| Overview | Overview.1 | |
|---|---|---|
| 0 | Today last price | 0.6385 |
| 1 | Today Daily Change | -0.0002 |
| 2 | Today Daily Change % | -0.03% |
| 3 | Today daily open | 0.6387 |
The pair remains strongly bullish on the daily timeframe. It trades above its 20 SMA @ 0.6323, 50 SMA 0.6267, 100 SMA @ 0.6049 and 200 SMA @ 0.6211.
| Trends | Trends.1 | |
|---|---|---|
| 0 | Daily SMA20 | 0.6323 |
| 1 | Daily SMA50 | 0.6267 |
| 2 | Daily SMA100 | 0.6049 |
| 3 | Daily SMA200 | 0.6211 |
The previous day high was 0.6417 while the previous day low was 0.6335. The daily 38.2% Fib levels comes at 0.6366, expected to provide support. Similarly, the daily 61.8% fib level is at 0.6385, expected to provide support.
Note the levels of interest below:
- Pivot support is noted at 0.6342, 0.6298, 0.6261
- Pivot resistance is noted at 0.6424, 0.6461, 0.6505
| Levels | Levels.1 |
|---|---|
| Previous Daily High | 0.6417 |
| Previous Daily Low | 0.6335 |
| Previous Weekly High | 0.6418 |
| Previous Weekly Low | 0.6314 |
| Previous Monthly High | 0.6514 |
| Previous Monthly Low | 0.6230 |
| Daily Fibonacci 38.2% | 0.6366 |
| Daily Fibonacci 61.8% | 0.6385 |
| Daily Pivot Point S1 | 0.6342 |
| Daily Pivot Point S2 | 0.6298 |
| Daily Pivot Point S3 | 0.6261 |
| Daily Pivot Point R1 | 0.6424 |
| Daily Pivot Point R2 | 0.6461 |
| Daily Pivot Point R3 | 0.6505 |
[/s2If]
Join Our Telegram Group
")


