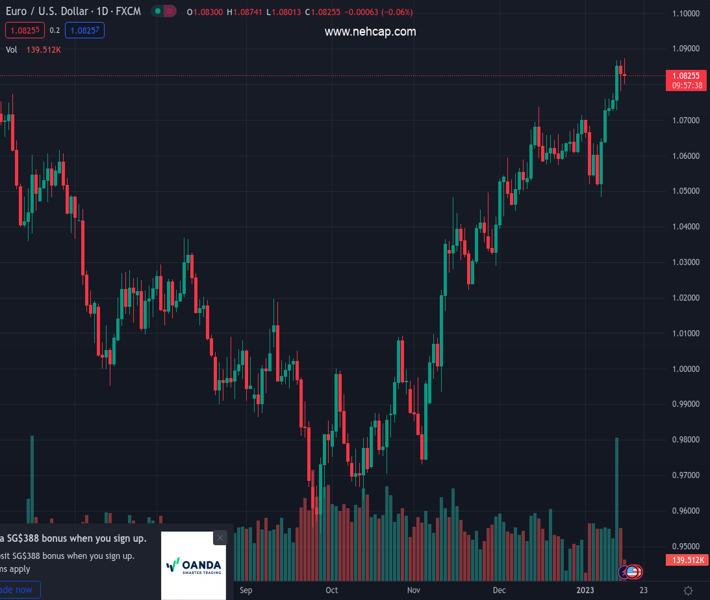
#EURUSD @ 1.08270 prints a new monthly high near 1.0880 on Monday. (Pivot Orderbook analysis)
…
This is a premium post.
[s2If !current_user_can(access_s2member_level4)]Please register for PREMIUM VERSION HERE to read full post below containing analysis. In case of any error or you think you are not able to read the full post below, please email us at support#nehcap.com [lwa][/s2If] [s2If current_user_can(access_s2member_level4)]
- EUR/USD prints a new monthly high near 1.0880 on Monday.
- The continuation of the uptrend could see 1.0900 revisited.
The pair currently trades last at 1.08270.
The previous day high was 1.0868 while the previous day low was 1.078. The daily 38.2% Fib levels comes at 1.0814, expected to provide support. Similarly, the daily 61.8% fib level is at 1.0835, expected to provide resistance.
EUR/USD struggles to get extra upside traction after recording new YTD peaks near 1.0880 at the beginning of the week.
Despite the ongoing indecision in the price action, bulls remain well in control of the sentiment for the time being. That said, further north of the January top at 1.0874 (January 16) should turn up the round level at 1.0900 in the relatively near term.
Furthermore, while above the short-term support line near 1.0570, the pair should retain the bullish view.
In the longer run, the constructive view remains unchanged while above the 200-day SMA at 1.0308.
Technical Levels: Supports and Resistances
EURUSD currently trading at 1.0832 at the time of writing. Pair opened at 1.0832 and is trading with a change of 0.0 % .
| Overview | Overview.1 | |
|---|---|---|
| 0 | Today last price | 1.0832 |
| 1 | Today Daily Change | 73.0000 |
| 2 | Today Daily Change % | 0.0000 |
| 3 | Today daily open | 1.0832 |
The pair remains strongly bullish on the daily timeframe. It trades above its 20 SMA @ 1.0659, 50 SMA 1.0502, 100 SMA @ 1.019 and 200 SMA @ 1.0311.
| Trends | Trends.1 | |
|---|---|---|
| 0 | Daily SMA20 | 1.0659 |
| 1 | Daily SMA50 | 1.0502 |
| 2 | Daily SMA100 | 1.0190 |
| 3 | Daily SMA200 | 1.0311 |
The previous day high was 1.0868 while the previous day low was 1.078. The daily 38.2% Fib levels comes at 1.0814, expected to provide support. Similarly, the daily 61.8% fib level is at 1.0835, expected to provide resistance.
Note the levels of interest below:
- Pivot support is noted at 1.0786, 1.0739, 1.0698
- Pivot resistance is noted at 1.0874, 1.0915, 1.0961
| Levels | Levels.1 |
|---|---|
| Previous Daily High | 1.0868 |
| Previous Daily Low | 1.0780 |
| Previous Weekly High | 1.0868 |
| Previous Weekly Low | 1.0639 |
| Previous Monthly High | 1.0736 |
| Previous Monthly Low | 1.0393 |
| Daily Fibonacci 38.2% | 1.0814 |
| Daily Fibonacci 61.8% | 1.0835 |
| Daily Pivot Point S1 | 1.0786 |
| Daily Pivot Point S2 | 1.0739 |
| Daily Pivot Point S3 | 1.0698 |
| Daily Pivot Point R1 | 1.0874 |
| Daily Pivot Point R2 | 1.0915 |
| Daily Pivot Point R3 | 1.0961 |
[/s2If]
Join Our Telegram Group
")


