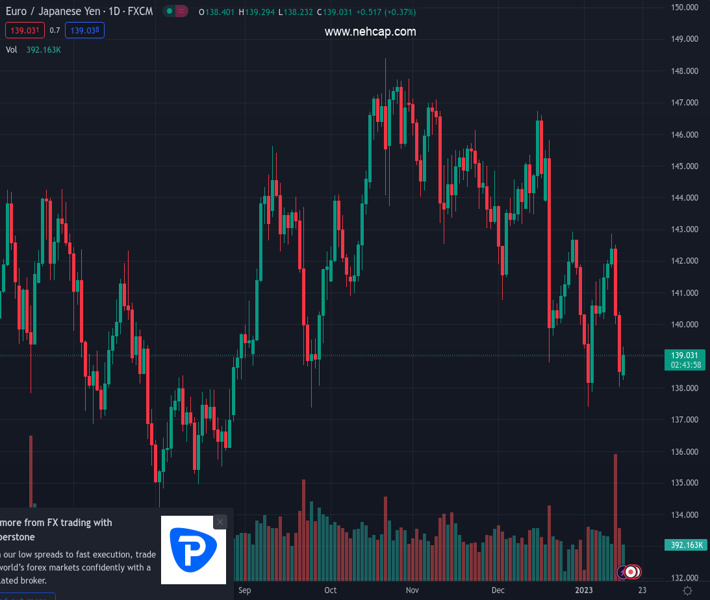
#EURJPY @ 139.044 bounced off last weekly lows and reclaimed 139.00 amidst a sour market sentiment. (Pivot Orderbook analysis)
…
This is a premium post.
[s2If !current_user_can(access_s2member_level4)]Please register for PREMIUM VERSION HERE to read full post below containing analysis. In case of any error or you think you are not able to read the full post below, please email us at support#nehcap.com [lwa][/s2If] [s2If current_user_can(access_s2member_level4)]
- EUR/JPY bounced off last weekly lows and reclaimed 139.00 amidst a sour market sentiment.
- EUR/JPY Price Analysis: Bearish below the 200-day EMA; otherwise, it could test 141.00.
The pair currently trades last at 139.044.
The previous day high was 140.44 while the previous day low was 138.01. The daily 38.2% Fib levels comes at 138.94, expected to provide support. Similarly, the daily 61.8% fib level is at 139.51, expected to provide resistance.
The EUR/JPY bounces off the last week’s low of 138.01 and climbs above the 139.00 figure, despite a sour sentiment. Hence, the Euro (EUR) gained some ground against the Japanese Yen (JPY), though it would likely be influenced by the Bank of Japan’s (BoJ) Wednesday’s monetary policy decision. At the time of writing, the EUR/JPY is trading at 139.10, up by 0.43%.
Even though the EUR/JPY is printing a leg-up, the overall trend is downwards once the cross dived below the 200-day Exponential Moving Average (EMA) at 140.19. The Relative Strength Index (RSI), although aiming up, it remains at bearish territory, suggesting that sellers remain in charge, while the Rate of Change (RoC), indicates that buyers are in charge. So, EUR/JPY might refrain from opening fresh shorts until having a clearer RSI signal, as the fundamental bias favors the JPY.
If the EUR/JPY fails to clear the 200-day EMA, that will keep the pair’s bias bearish. Therefore, the EUR/JPY first support would be the 139.00 mark. The break below will expose the 138.01 January 13 daily low, followed by the January 3 daily low of 137.38, followed by the 135.51 August 24 swing low.
On the other hand, EUR/JPY reclaiming the 200-day EMA would lif the pair towards the 20-day EMA at 140.99, followed by the 100-day EMA at 142.05, followed by the 50-day EMA at 142.15, ahead of 142.50.
Technical Levels: Supports and Resistances
EURJPY currently trading at 139.04 at the time of writing. Pair opened at 138.54 and is trading with a change of 0.36 % .
| Overview | Overview.1 | |
|---|---|---|
| 0 | Today last price | 139.04 |
| 1 | Today Daily Change | 0.50 |
| 2 | Today Daily Change % | 0.36 |
| 3 | Today daily open | 138.54 |
The pair remains strongly bearish on the daily time frame. It trades below the 20 SMA @ 140.96, 50 SMA 143.07, 100 SMA @ 143.14 and 200 SMA @ 140.7.
| Trends | Trends.1 | |
|---|---|---|
| 0 | Daily SMA20 | 140.96 |
| 1 | Daily SMA50 | 143.07 |
| 2 | Daily SMA100 | 143.14 |
| 3 | Daily SMA200 | 140.70 |
The previous day high was 140.44 while the previous day low was 138.01. The daily 38.2% Fib levels comes at 138.94, expected to provide support. Similarly, the daily 61.8% fib level is at 139.51, expected to provide resistance.
Note the levels of interest below:
- Pivot support is noted at 137.55, 136.57, 135.13
- Pivot resistance is noted at 139.98, 141.42, 142.4
| Levels | Levels.1 |
|---|---|
| Previous Daily High | 140.44 |
| Previous Daily Low | 138.01 |
| Previous Weekly High | 142.86 |
| Previous Weekly Low | 138.01 |
| Previous Monthly High | 146.73 |
| Previous Monthly Low | 138.80 |
| Daily Fibonacci 38.2% | 138.94 |
| Daily Fibonacci 61.8% | 139.51 |
| Daily Pivot Point S1 | 137.55 |
| Daily Pivot Point S2 | 136.57 |
| Daily Pivot Point S3 | 135.13 |
| Daily Pivot Point R1 | 139.98 |
| Daily Pivot Point R2 | 141.42 |
| Daily Pivot Point R3 | 142.40 |
[/s2If]
Join Our Telegram Group
")


