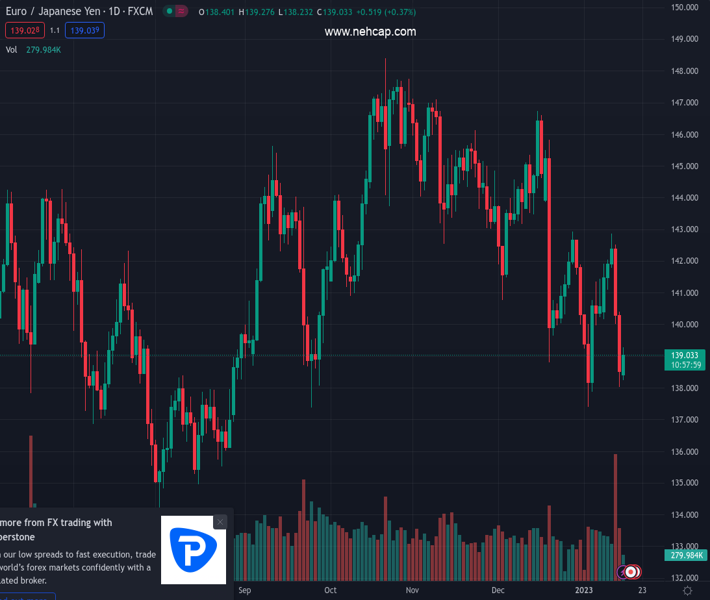
#EURJPY @ 139.037 manages to grab some upside traction above 139.00. (Pivot Orderbook analysis)
…
This is a premium post.
[s2If !current_user_can(access_s2member_level4)]Please register for PREMIUM VERSION HERE to read full post below containing analysis. In case of any error or you think you are not able to read the full post below, please email us at support#nehcap.com [lwa][/s2If] [s2If current_user_can(access_s2member_level4)]
- EUR/JPY manages to grab some upside traction above 139.00.
- Next on the upside for the cross appears the 200-day SMA.
The pair currently trades last at 139.037.
The previous day high was 140.44 while the previous day low was 138.01. The daily 38.2% Fib levels comes at 138.94, expected to provide support. Similarly, the daily 61.8% fib level is at 139.51, expected to provide resistance.
EUR/JPY gathers some much needed steam and reclaims the 139.00 hurdle and beyond at the beginning of the week.
The recent pronounced correction in the cross seems to have met some contention around the 138.00 neighbourhood. If the rebound picks up a more sustainable pace, then the next target of note turns up at the key 200-day SMA, today at 140.68.
Above the latter, the selling bias is expected to mitigate and could shift the outlook to a more constructive one.
Technical Levels: Supports and Resistances
EURJPY currently trading at 139.1 at the time of writing. Pair opened at 138.54 and is trading with a change of 0.4 % .
| Overview | Overview.1 | |
|---|---|---|
| 0 | Today last price | 139.10 |
| 1 | Today Daily Change | 104.00 |
| 2 | Today Daily Change % | 0.40 |
| 3 | Today daily open | 138.54 |
The pair remains strongly bearish on the daily time frame. It trades below the 20 SMA @ 140.96, 50 SMA 143.07, 100 SMA @ 143.14 and 200 SMA @ 140.7.
| Trends | Trends.1 | |
|---|---|---|
| 0 | Daily SMA20 | 140.96 |
| 1 | Daily SMA50 | 143.07 |
| 2 | Daily SMA100 | 143.14 |
| 3 | Daily SMA200 | 140.70 |
The previous day high was 140.44 while the previous day low was 138.01. The daily 38.2% Fib levels comes at 138.94, expected to provide support. Similarly, the daily 61.8% fib level is at 139.51, expected to provide resistance.
Note the levels of interest below:
- Pivot support is noted at 137.55, 136.57, 135.13
- Pivot resistance is noted at 139.98, 141.42, 142.4
| Levels | Levels.1 |
|---|---|
| Previous Daily High | 140.44 |
| Previous Daily Low | 138.01 |
| Previous Weekly High | 142.86 |
| Previous Weekly Low | 138.01 |
| Previous Monthly High | 146.73 |
| Previous Monthly Low | 138.80 |
| Daily Fibonacci 38.2% | 138.94 |
| Daily Fibonacci 61.8% | 139.51 |
| Daily Pivot Point S1 | 137.55 |
| Daily Pivot Point S2 | 136.57 |
| Daily Pivot Point S3 | 135.13 |
| Daily Pivot Point R1 | 139.98 |
| Daily Pivot Point R2 | 141.42 |
| Daily Pivot Point R3 | 142.40 |
[/s2If]
Join Our Telegram Group
")


