#AUDUSD @ 0.69518 The US Dollar stages a recovery on Monday after plunging to seven-month lows against a basket of currencies. (Pivot Orderbook analysis)
…
This is a premium post.
[s2If !current_user_can(access_s2member_level4)]Please register for PREMIUM VERSION HERE to read full post below containing analysis. In case of any error or you think you are not able to read the full post below, please email us at support#nehcap.com [lwa][/s2If] [s2If current_user_can(access_s2member_level4)]
- The US Dollar stages a recovery on Monday after plunging to seven-month lows against a basket of currencies.
- Australia’s inflation data might spur a reaction by the Reserve Bank of Australia as prices continue to elevate.
- AUD/USD Price Analysis: In a pullback, though expected to resume its uptrend, above 0.7000.
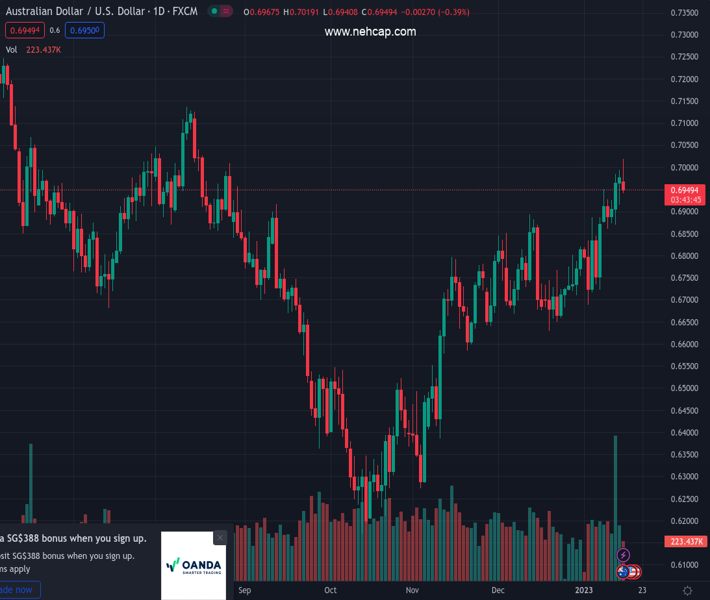
The pair currently trades last at 0.69518.
The previous day high was 0.6994 while the previous day low was 0.6915. The daily 38.2% Fib levels comes at 0.6964, expected to provide resistance. Similarly, the daily 61.8% fib level is at 0.6945, expected to provide support.
The Australian Dollar (AUD) losses momentum against the US Dollar (USD) and tumbles back below the 0.7000 figure, on low liquidity conditions, on the observance of Martin Luther King Jr. day. A risk-off impulse bolstered the US Dollar (USD), recovering some ground against most G8 currencies. Therefore, the AUD/USD is trading at 0.6952.
Although the US equities cash market is closed, the S&P 500 and Nasdaq Futures portray a dampened market sentiment. Last week’s US economic data, mainly inflation edging lower and consumer sentiment improved, as reported by the University of Michigan (UoM) poll, augmented speculations that the US Federal Reserve would tighten policy by 25 bps. Also, inflation expectations continue to drop as Americans remain optimistic that the US Central Bank could achieve a “soft landing.”
The US Dollar Index (DXY), which measures the greenback’s value against a basket of six currencies, edges up by almost 0.70%, at 128.730, despite the absence of US traders, a headwind for the AUD/USD.
On the Australian front, its economic calendar featured the Melbourne Institute Monthly Inflation gauge, which showed that inflation decelerated by 0.2%. The latest data showed signs that Australia’s inflation figures remained high, both in terms of quarterly and monthly readings. The annual inflation rate in Australia climbed to an over three-decade high of 7.3% in Q3 of 2022 from 6.1% in Q2. Meanwhile, monthly data showed Australia’s CPI rose to a record high of 7.3% YoY in November, well above the Reserve Bank of Australia’s (RBA) 2% to 3% target, fueling expectations for additional tightening by the RBA.
After rallying for three consecutive days to fresh multi-month highs at 0.7019, the AUD/USD it’s retracing to the mid-0.69-0.70 range. Although at bullish territory, the Relative Strength Index (RSI) aims down, contrarily to the Rate of Change (RoC), which shows volatility is increasing. Hence, the AUD/USD traders might refrain from opening fresh long positions until the RSI shifts upwards, though the path of least resistance is upwards.
Hence, the AUD/USD key resistance levels would be 0.7000, the new 7-month high hit on January’s 16 sessions at 0.7019, and the August 11 daily high of 0.7136.
Technical Levels: Supports and Resistances
AUDUSD currently trading at 0.6952 at the time of writing. Pair opened at 0.6978 and is trading with a change of -0.37 % .
| Overview | Overview.1 | |
|---|---|---|
| 0 | Today last price | 0.6952 |
| 1 | Today Daily Change | -0.0026 |
| 2 | Today Daily Change % | -0.3700 |
| 3 | Today daily open | 0.6978 |
The pair remains strongly bullish on the daily timeframe. It trades above its 20 SMA @ 0.6795, 50 SMA 0.6739, 100 SMA @ 0.6635 and 200 SMA @ 0.6831.
| Trends | Trends.1 | |
|---|---|---|
| 0 | Daily SMA20 | 0.6795 |
| 1 | Daily SMA50 | 0.6739 |
| 2 | Daily SMA100 | 0.6635 |
| 3 | Daily SMA200 | 0.6831 |
The previous day high was 0.6994 while the previous day low was 0.6915. The daily 38.2% Fib levels comes at 0.6964, expected to provide resistance. Similarly, the daily 61.8% fib level is at 0.6945, expected to provide support.
Note the levels of interest below:
- Pivot support is noted at 0.6931, 0.6884, 0.6852
- Pivot resistance is noted at 0.7009, 0.7041, 0.7088
| Levels | Levels.1 |
|---|---|
| Previous Daily High | 0.6994 |
| Previous Daily Low | 0.6915 |
| Previous Weekly High | 0.6994 |
| Previous Weekly Low | 0.6860 |
| Previous Monthly High | 0.6893 |
| Previous Monthly Low | 0.6629 |
| Daily Fibonacci 38.2% | 0.6964 |
| Daily Fibonacci 61.8% | 0.6945 |
| Daily Pivot Point S1 | 0.6931 |
| Daily Pivot Point S2 | 0.6884 |
| Daily Pivot Point S3 | 0.6852 |
| Daily Pivot Point R1 | 0.7009 |
| Daily Pivot Point R2 | 0.7041 |
| Daily Pivot Point R3 | 0.7088 |
[/s2If]
Join Our Telegram Group
")


