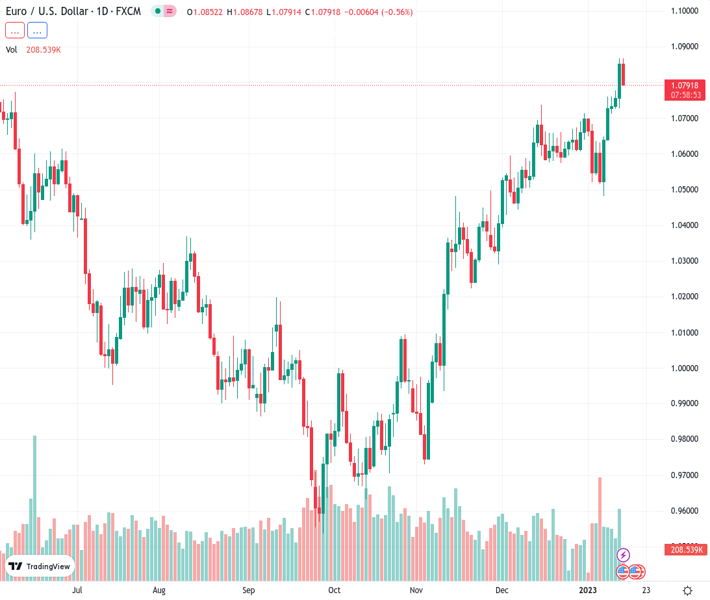
#EURUSD @ 1.07938 sees its recent strong advance momentarily halted. (Pivot Orderbook analysis)
…
This is a premium post.
[s2If !current_user_can(access_s2member_level4)]Please register for PREMIUM VERSION HERE to read full post below containing analysis. In case of any error or you think you are not able to read the full post below, please email us at support#nehcap.com [lwa][/s2If] [s2If current_user_can(access_s2member_level4)]
- EUR/USD sees its recent strong advance momentarily halted.
- The resumption of the bullish bias should target the 1.0900 level.
The pair currently trades last at 1.07938.
The previous day high was 1.0867 while the previous day low was 1.0731. The daily 38.2% Fib levels comes at 1.0815, expected to provide resistance. Similarly, the daily 61.8% fib level is at 1.0783, expected to provide support.
EUR/USD comes under pressure soon after hitting fresh 9-month peaks around 1.0870 on Friday.
Despite the ongoing knee-jerk, bulls remain well in control of the mood around the pair for the time being. Against that, further north of the so far YTD high at 1.0867 (January 13) should appear the round level at 1.0900 in the short-term horizon.
Furthermore, while above the short-term support line near 1.0550, the pair should maintain its bullish outlook.
In the longer run, the constructive view remains unchanged while above the 200-day SMA at 1.0308.
Technical Levels: Supports and Resistances
EURUSD currently trading at 1.082 at the time of writing. Pair opened at 1.0852 and is trading with a change of -0.29 % .
| Overview | Overview.1 | |
|---|---|---|
| 0 | Today last price | 1.0820 |
| 1 | Today Daily Change | 64.0000 |
| 2 | Today Daily Change % | -0.2900 |
| 3 | Today daily open | 1.0852 |
The pair remains strongly bullish on the daily timeframe. It trades above its 20 SMA @ 1.0647, 50 SMA 1.0485, 100 SMA @ 1.0182 and 200 SMA @ 1.0311.
| Trends | Trends.1 | |
|---|---|---|
| 0 | Daily SMA20 | 1.0647 |
| 1 | Daily SMA50 | 1.0485 |
| 2 | Daily SMA100 | 1.0182 |
| 3 | Daily SMA200 | 1.0311 |
The previous day high was 1.0867 while the previous day low was 1.0731. The daily 38.2% Fib levels comes at 1.0815, expected to provide resistance. Similarly, the daily 61.8% fib level is at 1.0783, expected to provide support.
Note the levels of interest below:
- Pivot support is noted at 1.0767, 1.0681, 1.0631
- Pivot resistance is noted at 1.0903, 1.0953, 1.1039
| Levels | Levels.1 |
|---|---|
| Previous Daily High | 1.0867 |
| Previous Daily Low | 1.0731 |
| Previous Weekly High | 1.0710 |
| Previous Weekly Low | 1.0483 |
| Previous Monthly High | 1.0736 |
| Previous Monthly Low | 1.0393 |
| Daily Fibonacci 38.2% | 1.0815 |
| Daily Fibonacci 61.8% | 1.0783 |
| Daily Pivot Point S1 | 1.0767 |
| Daily Pivot Point S2 | 1.0681 |
| Daily Pivot Point S3 | 1.0631 |
| Daily Pivot Point R1 | 1.0903 |
| Daily Pivot Point R2 | 1.0953 |
| Daily Pivot Point R3 | 1.1039 |
[/s2If]
Join Our Telegram Group
")


