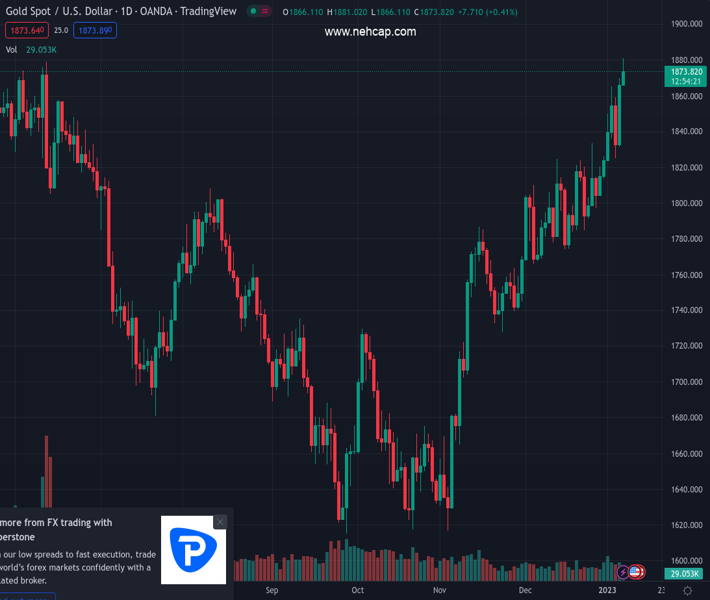
#XAUUSD @ 1,873.24 Gold price hits an eight-month high on Monday and is supported by a combination of factors. (Pivot Orderbook analysis)
…
This is a premium post.
[s2If !current_user_can(access_s2member_level4)]Please register for PREMIUM VERSION HERE to read full post below containing analysis. In case of any error or you think you are not able to read the full post below, please email us at support#nehcap.com [lwa][/s2If] [s2If current_user_can(access_s2member_level4)]
- Gold price hits an eight-month high on Monday and is supported by a combination of factors.
- The prospects for less aggressive Fed rate hikes weigh on the US Dollar and remain supportive.
- The prevalent risk-on environment turns out to be the only factor capping gains for Gold price.
The pair currently trades last at 1873.24.
The previous day high was 1869.91 while the previous day low was 1830.62. The daily 38.2% Fib levels comes at 1854.9, expected to provide support. Similarly, the daily 61.8% fib level is at 1845.63, expected to provide support.
Gold price gains positive traction for the second successive day on Monday and climbs to an eight-month high, around the $1,880 area during the early European session. This comes on the back of Friday’s breakout through the $1,860-$1,865 hurdle and favours bullish traders.
The US Dollar (USD) adds to Friday’s heavy losses inspired by softer macro-data, which lifted bets for a less-aggressive policy tightening by the Federal Reserve (Fed). This, in turn, is seen as a key factor benefitting the US Dollar-denominated Gold price. In fact, the closely-watched monthly jobs report from the United States (US) showed that Average Hourly Earnings grew 0.3% last month and the yearly rate eased to 4.6% from 4.8% in November. This suggests that inflation pressures could be weakening and allow the US central bank to further slow the pace of its rate-hiking cycle.
The prospect for a less hawkish Fed is evident from the ongoing decline in the US Treasury bond yields. This further contributes to the offered tone surrounding the Greenback and provides an additional boost to the non-yielding Gold price. The aforementioned supporting factors suggest that the path of least resistance for the XAU/USD is to the upside. That said, the prevalent risk-on mood – as depicted by a generally positive tone around the equity markets – might hold back traders from placing aggressive bullish bets around the safe-haven precious metal, at least for the time being.
Investors cheered China’s biggest pivot away from its strict zero-COVID policy. In fact, China opened its borders over the weekend for the first time in three years. That said, concerns that the massive flow of Chinese travellers may cause another surge in COVID infections and growing worries about a deeper global economic downturn should cap any optimism in the markets. This further adds credence to the positive outlook for the Gold price which tends to act as a safe-haven. Hence, any meaningful pullback could be seen as a buying opportunity and is more likely to remain limited in the absence of any relevant macro releases.
From a technical perspective, the $1,865-$1,860 resistance breakpoint now seems to act as immediate support for the Gold price. A sustained break below might prompt some technical selling, though is more likely to get bought into near the $1,835-$1,833 horizontal support. On the flip side, some follow-through buying should allow bulls to aim to reclaim the $1,900 round figure for the first time since May 2022.
Technical Levels: Supports and Resistances
XAUUSD currently trading at 1876.37 at the time of writing. Pair opened at 1866.99 and is trading with a change of 0.5 % .
| Overview | Overview.1 | |
|---|---|---|
| 0 | Today last price | 1876.37 |
| 1 | Today Daily Change | 9.38 |
| 2 | Today Daily Change % | 0.50 |
| 3 | Today daily open | 1866.99 |
The pair remains strongly bullish on the daily timeframe. It trades above its 20 SMA @ 1812.3, 50 SMA 1768.68, 100 SMA @ 1726.95 and 200 SMA @ 1778.09.
| Trends | Trends.1 | |
|---|---|---|
| 0 | Daily SMA20 | 1812.30 |
| 1 | Daily SMA50 | 1768.68 |
| 2 | Daily SMA100 | 1726.95 |
| 3 | Daily SMA200 | 1778.09 |
The previous day high was 1869.91 while the previous day low was 1830.62. The daily 38.2% Fib levels comes at 1854.9, expected to provide support. Similarly, the daily 61.8% fib level is at 1845.63, expected to provide support.
Note the levels of interest below:
- Pivot support is noted at 1841.77, 1816.55, 1802.48
- Pivot resistance is noted at 1881.06, 1895.13, 1920.35
| Levels | Levels.1 |
|---|---|
| Previous Daily High | 1869.91 |
| Previous Daily Low | 1830.62 |
| Previous Weekly High | 1869.91 |
| Previous Weekly Low | 1823.76 |
| Previous Monthly High | 1833.38 |
| Previous Monthly Low | 1765.89 |
| Daily Fibonacci 38.2% | 1854.90 |
| Daily Fibonacci 61.8% | 1845.63 |
| Daily Pivot Point S1 | 1841.77 |
| Daily Pivot Point S2 | 1816.55 |
| Daily Pivot Point S3 | 1802.48 |
| Daily Pivot Point R1 | 1881.06 |
| Daily Pivot Point R2 | 1895.13 |
| Daily Pivot Point R3 | 1920.35 |
[/s2If]
Join Our Telegram Group
")


