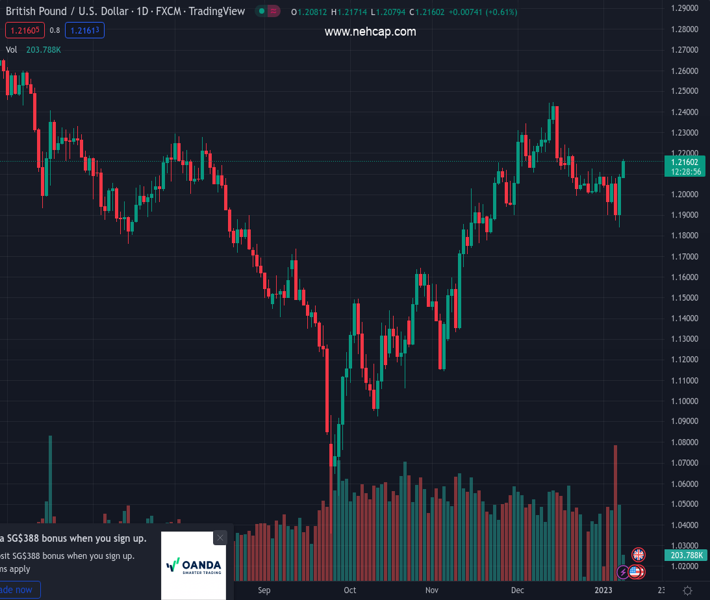
#GBPUSD @ 1.21647 gains traction for the second straight day and climbs to over a two-week high. (Pivot Orderbook analysis)
…
This is a premium post.
[s2If !current_user_can(access_s2member_level4)]Please register for PREMIUM VERSION HERE to read full post below containing analysis. In case of any error or you think you are not able to read the full post below, please email us at support#nehcap.com [lwa][/s2If] [s2If current_user_can(access_s2member_level4)]
- GBP/USD gains traction for the second straight day and climbs to over a two-week high.
- A combination of factors keeps the USD bulls on the defensive and remains supportive.
- Looming recession risks could cap the optimism and lend support to the safe-haven buck.
The pair currently trades last at 1.21647.
The previous day high was 1.21 while the previous day low was 1.1841. The daily 38.2% Fib levels comes at 1.2001, expected to provide support. Similarly, the daily 61.8% fib level is at 1.194, expected to provide support.
The GBP/USD pair builds on Friday’s solid recovery from a six-week low and gains strong follow-through traction for the second successive day. The momentum lifts spot prices to a two-and-half-week high, around the 1.2170 area during the first half of the European session and is sponsored by the prevalent US Dollar selling bias.
In fact, the USD Index, which tracks the greenback against a basket of six currencies, hangs near the monthly low and is pressured by a combination of factors. Friday’s mixed US monthly jobs report (NFP) and the disappointing release of the US ISM Services PMI fueled speculations that the Fed will soften its hawkish stance. In fact, the markets are now pricing in a 25 bps Fed rate hike move in February, which leads to a further decline in the US Treasury bond yields. Apart from this, a positive risk tone further dents the greenback’s relative safe-haven status and offers additional support to the GBP/USD pair.
China’s pivoted away from its strict zero-COVID policy and opened its borders over the weekend for the first time in three years. This, in turn, boosted investors’ appetite for riskier assets, which is evident from the upbeat mood around the equity markets. Investors, however, remain concerned that the massive flow of Chinese travellers may cause another surge in COVID infections. Apart from this, the protracted Russia-Ukraine war has been fueling worries about a deeper global economic downturn, which should cap any optimism in the markets. This could lend some support to the buck and cap gains for the GBP/USD pair.
Traders might also refrain from placing aggressive bets and prefer to move to the sidelines ahead of the release of the latest US consumer inflation figures on Thursday. The crucial US CPI could influence the US central bank’s near-term policy outlook and provide a fresh directional impetus to the GBP/USD pair. In the meantime, the US bond yields, along with the broader risk sentiment, will drive the USD demand and provide some impetus to the major in the absence of any major market-moving economic releases on Monday.
Technical Levels: Supports and Resistances
GBPUSD currently trading at 1.216 at the time of writing. Pair opened at 1.2095 and is trading with a change of 0.54 % .
| Overview | Overview.1 | |
|---|---|---|
| 0 | Today last price | 1.2160 |
| 1 | Today Daily Change | 0.0065 |
| 2 | Today Daily Change % | 0.5400 |
| 3 | Today daily open | 1.2095 |
The pair remains strongly bullish on the daily timeframe. It trades above its 20 SMA @ 1.2111, 50 SMA 1.1957, 100 SMA @ 1.1669 and 200 SMA @ 1.2019.
| Trends | Trends.1 | |
|---|---|---|
| 0 | Daily SMA20 | 1.2111 |
| 1 | Daily SMA50 | 1.1957 |
| 2 | Daily SMA100 | 1.1669 |
| 3 | Daily SMA200 | 1.2019 |
The previous day high was 1.21 while the previous day low was 1.1841. The daily 38.2% Fib levels comes at 1.2001, expected to provide support. Similarly, the daily 61.8% fib level is at 1.194, expected to provide support.
Note the levels of interest below:
- Pivot support is noted at 1.1925, 1.1754, 1.1667
- Pivot resistance is noted at 1.2183, 1.227, 1.2441
| Levels | Levels.1 |
|---|---|
| Previous Daily High | 1.2100 |
| Previous Daily Low | 1.1841 |
| Previous Weekly High | 1.2102 |
| Previous Weekly Low | 1.1841 |
| Previous Monthly High | 1.2447 |
| Previous Monthly Low | 1.1992 |
| Daily Fibonacci 38.2% | 1.2001 |
| Daily Fibonacci 61.8% | 1.1940 |
| Daily Pivot Point S1 | 1.1925 |
| Daily Pivot Point S2 | 1.1754 |
| Daily Pivot Point S3 | 1.1667 |
| Daily Pivot Point R1 | 1.2183 |
| Daily Pivot Point R2 | 1.2270 |
| Daily Pivot Point R3 | 1.2441 |
[/s2If]
Join Our Telegram Group
")


