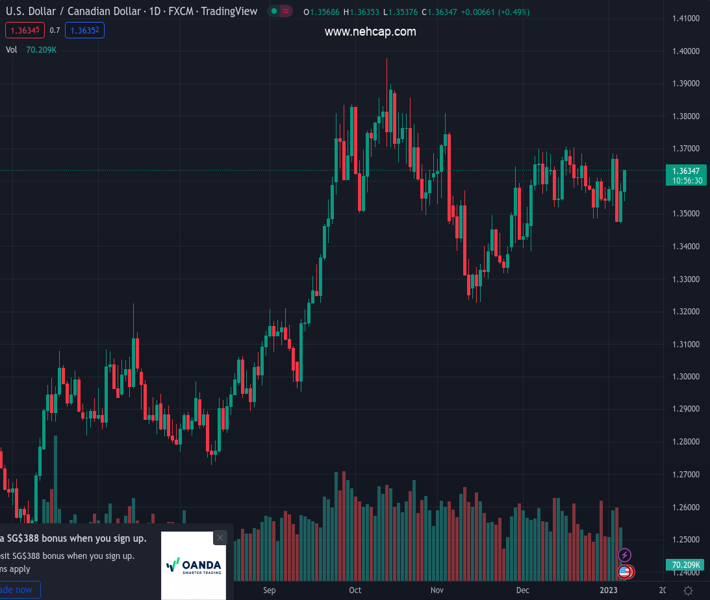
#USDCAD @ 1.36336 turns positive for the second straight day and is supported by a combination of factors. (Pivot Orderbook analysis)
…
This is a premium post.
[s2If !current_user_can(access_s2member_level4)]Please register for PREMIUM VERSION HERE to read full post below containing analysis. In case of any error or you think you are not able to read the full post below, please email us at support#nehcap.com [lwa][/s2If] [s2If current_user_can(access_s2member_level4)]
- USD/CAD turns positive for the second straight day and is supported by a combination of factors.
- A downtick in oil prices undermines the Loonie and acts as a tailwind amid sustained USD buying.
- Investors now look to the monthly employment data from the US and Canada for a fresh impetus.
The pair currently trades last at 1.36336.
The previous day high was 1.3596 while the previous day low was 1.347. The daily 38.2% Fib levels comes at 1.3548, expected to provide support. Similarly, the daily 61.8% fib level is at 1.3518, expected to provide support.
The USD/CAD pair attracts fresh buying near the 1.3540-1.3535 area on Friday and builds on the previous day’s goodish rebound from the vicinity of the 100-day SMA support. The uptick, also marking the second successive day of a positive move, lifts spot prices to the 1.3625-1.3630 area during the first half of the European session and is sponsored by a combination of factors.
Crude oil prices struggle to capitalize on the overnight gains and edge lower on the last day of the week, which, in turn, undermines the commodity-linked Loonie. Despite the latest optimism led by the easing of strict COVID-19 curbs in China, which is expected to boost fuel demand, looming recession risks act as a headwind for the black liquid. This, along with a strong follow-through buying around the US Dollar, offers additional support to the USD/CAD pair and remains supportive of the momentum.
The USD continues to draw support from Thursday’s upbeat US macro data, which pointed to a resilient US labour market and could allow the Federal Reserve to stick to its aggressive rate hike path. This, along with the prevalent cautious market mood, further seems to benefit the safe-haven greenback. It, however, remains to be seen if the USD bulls can retain control or opt to lighten their bets ahead of the closely-watched US monthly jobs data, due for release during the early North American session.
The popularly known US NFP report, due for release later during the early North American session, could influence the Fed’s near-term policy outlook. This, in turn, will play a key role in driving the USD demand. Investors will further take cues from the release of the monthly employment details from Canada, which, along with oil price dynamics, should provide some meaningful impetus to the USD/CAD pair.
Technical Levels: Supports and Resistances
USDCAD currently trading at 1.3624 at the time of writing. Pair opened at 1.3581 and is trading with a change of 0.32 % .
| Overview | Overview.1 | |
|---|---|---|
| 0 | Today last price | 1.3624 |
| 1 | Today Daily Change | 0.0043 |
| 2 | Today Daily Change % | 0.3200 |
| 3 | Today daily open | 1.3581 |
The pair remains strongly bullish on the daily timeframe. It trades above its 20 SMA @ 1.3598, 50 SMA 1.3525, 100 SMA @ 1.3471 and 200 SMA @ 1.3143.
| Trends | Trends.1 | |
|---|---|---|
| 0 | Daily SMA20 | 1.3598 |
| 1 | Daily SMA50 | 1.3525 |
| 2 | Daily SMA100 | 1.3471 |
| 3 | Daily SMA200 | 1.3143 |
The previous day high was 1.3596 while the previous day low was 1.347. The daily 38.2% Fib levels comes at 1.3548, expected to provide support. Similarly, the daily 61.8% fib level is at 1.3518, expected to provide support.
Note the levels of interest below:
- Pivot support is noted at 1.3503, 1.3424, 1.3378
- Pivot resistance is noted at 1.3628, 1.3674, 1.3753
| Levels | Levels.1 |
|---|---|
| Previous Daily High | 1.3596 |
| Previous Daily Low | 1.3470 |
| Previous Weekly High | 1.3612 |
| Previous Weekly Low | 1.3484 |
| Previous Monthly High | 1.3705 |
| Previous Monthly Low | 1.3385 |
| Daily Fibonacci 38.2% | 1.3548 |
| Daily Fibonacci 61.8% | 1.3518 |
| Daily Pivot Point S1 | 1.3503 |
| Daily Pivot Point S2 | 1.3424 |
| Daily Pivot Point S3 | 1.3378 |
| Daily Pivot Point R1 | 1.3628 |
| Daily Pivot Point R2 | 1.3674 |
| Daily Pivot Point R3 | 1.3753 |
[/s2If]
Join Our Telegram Group
")


