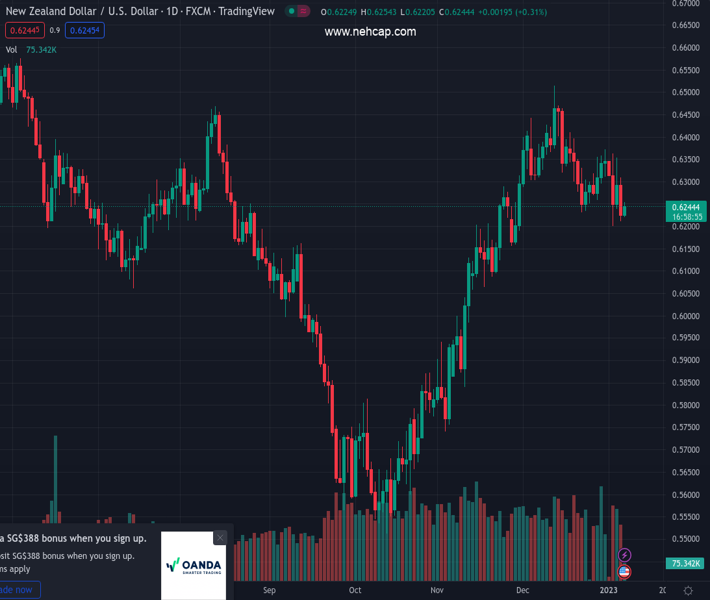
#NZDUSD @ 0.62454 is looking to stretch its recovery above 0.6250 backed by a rebound in the risk-on mood. (Pivot Orderbook analysis)
…
This is a premium post.
[s2If !current_user_can(access_s2member_level4)]Please register for PREMIUM VERSION HERE to read full post below containing analysis. In case of any error or you think you are not able to read the full post below, please email us at support#nehcap.com [lwa][/s2If] [s2If current_user_can(access_s2member_level4)]
- NZD/USD is looking to stretch its recovery above 0.6250 backed by a rebound in the risk-on mood.
- The US Dollar Index is struggling below 104.80 ahead of the US NFP data release.
- Upbeat US ADP Employment Change data has resulted in more troubles for the Fed policymakers.
The pair currently trades last at 0.62454.
The previous day high was 0.6341 while the previous day low was 0.621. The daily 38.2% Fib levels comes at 0.626, expected to provide resistance. Similarly, the daily 61.8% fib level is at 0.6291, expected to provide resistance.
The NZD/USD pair is struggling to extend its recovery above the immediate resistance of 0.6250 in the Asian session. The Kiwi asset rebounded firmly to near 0.6220 as investors shrugged off the United States’ upbeat employment-inspired volatility. On Thursday risk-sensitive currencies witnessed extreme selling pressure after the US Automatic Data Processing (ADP) Employment Change reported the stronger-than-projected addition of fresh payrolls in December.
The US Dollar Index (DXY) is hovering in an extremely narrow range below the immediate resistance of 104.80 as investors await US Nonfarm Payrolls (NFP) data release for fresh impetus. Meanwhile, the S&P500 futures have rebounded significantly, portraying a recovery in the risk-on impulse. The 10-year US Treasury Yields are displaying a subdued performance and are hovering below 3.72%.
The release of the upbeat US ADP Employment data proved that the tight labor market is going to be the major hurdle for the Federal Reserve (Fed) in its way toward achieving price stability. There is no denying the fact that firms must be offering higher wages to attract talent amid solid labor demand. So, any further rebound in the US Consumer Price Index (CPI) may stem from higher wage inflation.
In the meantime, analysts at TD Securities have come forward with expectations for interest rate hikes for CY2023.
Commenting on the minutes of the Federal Reserve’s December policy meeting, TD Securities analysts noted that officials remained in broad agreement about the need to push the policy stance further into restrictive territory in the near term. Therefore it expects another 50 basis points (bps) rate increase in February, and expects 25 bps rate hikes in March and May. It projects that the Fed will therefore settle on a terminal Fed funds target rate range of 5.25%-5.50% by May.”
Meanwhile rising cases of Covid-19 in China will continue to impact the New Zealand Dollar. Economic activities in China are continuously scaling down as firms have still not resumed operations on a full-fledged note. It is worth noting that New Zealand is one of the leading trading partner of China and a decline in the volume of economic activities in the Sino region impact the New Zealand Dollar.
Technical Levels: Supports and Resistances
NZDUSD currently trading at 0.625 at the time of writing. Pair opened at 0.6229 and is trading with a change of 0.34 % .
| Overview | Overview.1 | |
|---|---|---|
| 0 | Today last price | 0.6250 |
| 1 | Today Daily Change | 0.0021 |
| 2 | Today Daily Change % | 0.3400 |
| 3 | Today daily open | 0.6229 |
The pair is trading below its 20 Daily moving average @ 0.6333, above its 50 Daily moving average @ 0.62 , above its 100 Daily moving average @ 0.6038 and above its 200 Daily moving average @ 0.6228
| Trends | Trends.1 | |
|---|---|---|
| 0 | Daily SMA20 | 0.6333 |
| 1 | Daily SMA50 | 0.6200 |
| 2 | Daily SMA100 | 0.6038 |
| 3 | Daily SMA200 | 0.6228 |
The previous day high was 0.6341 while the previous day low was 0.621. The daily 38.2% Fib levels comes at 0.626, expected to provide resistance. Similarly, the daily 61.8% fib level is at 0.6291, expected to provide resistance.
Note the levels of interest below:
- Pivot support is noted at 0.6179, 0.6129, 0.6047
- Pivot resistance is noted at 0.631, 0.6391, 0.6442
| Levels | Levels.1 |
|---|---|
| Previous Daily High | 0.6341 |
| Previous Daily Low | 0.6210 |
| Previous Weekly High | 0.6373 |
| Previous Weekly Low | 0.6253 |
| Previous Monthly High | 0.6514 |
| Previous Monthly Low | 0.6230 |
| Daily Fibonacci 38.2% | 0.6260 |
| Daily Fibonacci 61.8% | 0.6291 |
| Daily Pivot Point S1 | 0.6179 |
| Daily Pivot Point S2 | 0.6129 |
| Daily Pivot Point S3 | 0.6047 |
| Daily Pivot Point R1 | 0.6310 |
| Daily Pivot Point R2 | 0.6391 |
| Daily Pivot Point R3 | 0.6442 |
[/s2If]
Join Our Telegram Group
")


