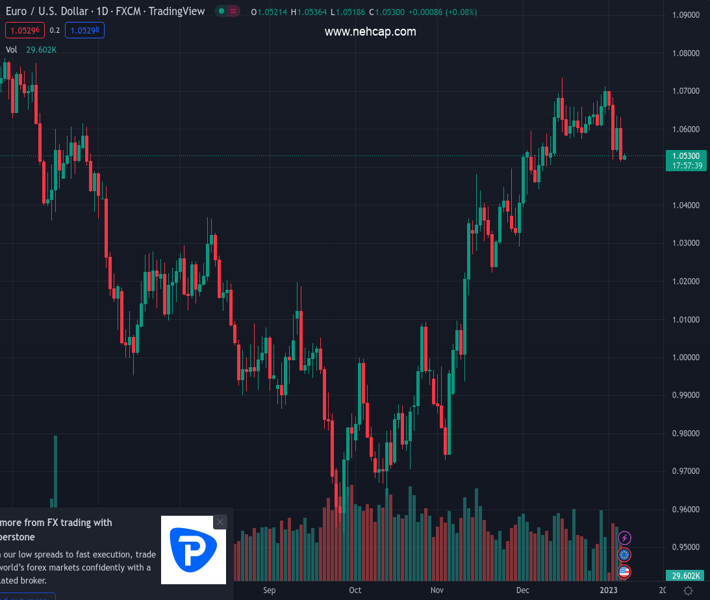
#EURUSD @ 1.05321 A decent recovery in S&P500 futures indicates that the risk-on profile has regained traction. (Pivot Orderbook analysis)
…
This is a premium post.
[s2If !current_user_can(access_s2member_level4)]Please register for PREMIUM VERSION HERE to read full post below containing analysis. In case of any error or you think you are not able to read the full post below, please email us at support#nehcap.com [lwa][/s2If] [s2If current_user_can(access_s2member_level4)]
- A decent recovery in S&P500 futures indicates that the risk-on profile has regained traction.
- Investors are awaiting the release of the Eurozone Inflation and US NFP for fresh impetus.
- The RSI (14) has shifted into the bearish range, which indicates that the downside momentum has been triggered.
The pair currently trades last at 1.05321.
The previous day high was 1.0632 while the previous day low was 1.0515. The daily 38.2% Fib levels comes at 1.056, expected to provide resistance. Similarly, the daily 61.8% fib level is at 1.0587, expected to provide resistance.
The EUR/USD pair has displayed a rebound move after gauging an immediate cushion around 1.0520. It would be prudent not to consider it a reversal for now as volatility is likely to remain on a lower note ahead of the release of the United States Nonfarm Payrolls (NFP) data and Eurozone Inflation for fresh cues.
The risk-on profile has gained traction amid a decent recovery in risk-sensitive assets like S&P500 futures. Meanwhile, the US Dollar Index (DXY) is struggling to surpass its crucial resistance around 104.80.
A bearish trend led by the formation of lower highs and lower lows is clear on an hourly scale. Earlier, the 200-period Exponential Moving Average (EMA) at 1.0610, which was acting as major support for the shared currency has turned into a major hurdle for the latter.
Also, the Relative Strength Index (RSI) (14) has shifted into the bearish range of 20.00-40.00, which indicates that the bearish momentum has been activated.
Should the major currency pair break below Thursday’s low at 1.0515, US Dollar will get strengthened and will drag the asset towards December 8 low at 1.0490 followed by December 7 low at 1.0443.
Alternatively, a decisive move above Wednesday’s high at 1.0643 will drive the asset towards December 30 high at 1.0713. A break above the latter will support EUR/USD to recapture its seven-month high at 1.0736.
Technical Levels: Supports and Resistances
EURUSD currently trading at 1.0533 at the time of writing. Pair opened at 1.052 and is trading with a change of 0.12 % .
| Overview | Overview.1 | |
|---|---|---|
| 0 | Today last price | 1.0533 |
| 1 | Today Daily Change | 0.0013 |
| 2 | Today Daily Change % | 0.1200 |
| 3 | Today daily open | 1.0520 |
The pair is trading below its 20 Daily moving average @ 1.0611, above its 50 Daily moving average @ 1.0396 , above its 100 Daily moving average @ 1.0144 and above its 200 Daily moving average @ 1.0316
| Trends | Trends.1 | |
|---|---|---|
| 0 | Daily SMA20 | 1.0611 |
| 1 | Daily SMA50 | 1.0396 |
| 2 | Daily SMA100 | 1.0144 |
| 3 | Daily SMA200 | 1.0316 |
The previous day high was 1.0632 while the previous day low was 1.0515. The daily 38.2% Fib levels comes at 1.056, expected to provide resistance. Similarly, the daily 61.8% fib level is at 1.0587, expected to provide resistance.
Note the levels of interest below:
- Pivot support is noted at 1.048, 1.0439, 1.0363
- Pivot resistance is noted at 1.0596, 1.0672, 1.0712
| Levels | Levels.1 |
|---|---|
| Previous Daily High | 1.0632 |
| Previous Daily Low | 1.0515 |
| Previous Weekly High | 1.0713 |
| Previous Weekly Low | 1.0607 |
| Previous Monthly High | 1.0736 |
| Previous Monthly Low | 1.0393 |
| Daily Fibonacci 38.2% | 1.0560 |
| Daily Fibonacci 61.8% | 1.0587 |
| Daily Pivot Point S1 | 1.0480 |
| Daily Pivot Point S2 | 1.0439 |
| Daily Pivot Point S3 | 1.0363 |
| Daily Pivot Point R1 | 1.0596 |
| Daily Pivot Point R2 | 1.0672 |
| Daily Pivot Point R3 | 1.0712 |
[/s2If]
Join Our Telegram Group
")


