#USDJPY @ 133.400 A four-month-old downslope trendline break could shift the bias to upwards. (Pivot Orderbook analysis)
…
This is a premium post.
[s2If !current_user_can(access_s2member_level4)]Please register for PREMIUM VERSION HERE to read full post below containing analysis. In case of any error or you think you are not able to read the full post below, please email us at support#nehcap.com [lwa][/s2If] [s2If current_user_can(access_s2member_level4)]
- A four-month-old downslope trendline break could shift the USD/JPY bias to upwards.
- USD/JPY Price Analysis: Neutral biased, but could turn bullish above the 200-DMA.
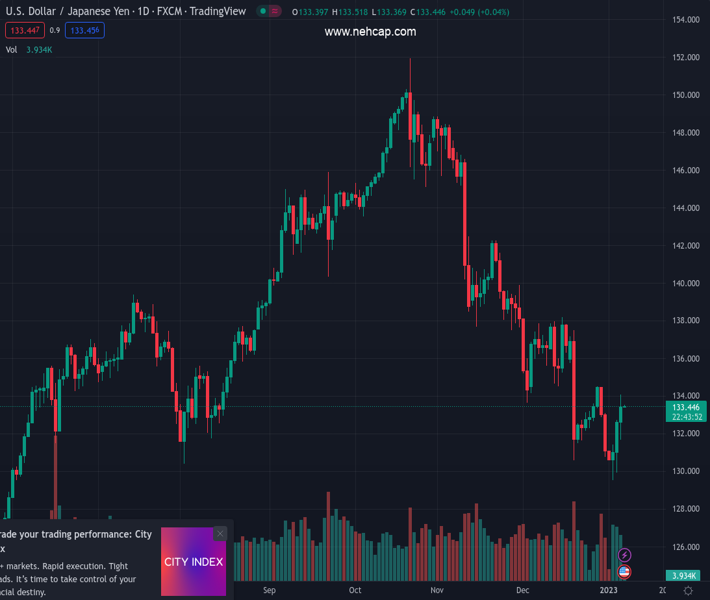
The pair currently trades last at 133.400.
The previous day high was 132.72 while the previous day low was 129.93. The daily 38.2% Fib levels comes at 131.65, expected to provide support. Similarly, the daily 61.8% fib level is at 130.99, expected to provide support.
The USD/JPY advance towards the 20-day Exponential Moving Average (EMA) as Friday’s Asian Pacific session begins, though it remains shy of piercing the 133.82 area, following Thursday’s 0.60% gain. At the time of typing, the USD/JPY is trading at 133.42
From a technical perspective, the USD/JPY shifted its bias from downward to neutral biased. After the USD/JPY bottomed around 129.50, the major rallied 3% and reclaimed the 133.00 figure. Additionally, it’s testing a four-month-old downslope trendline drawn from 2022 highs above 150.00, which, once broken, could open the door for a test of the 200-day Exponential Moving Average (EMA) at 134.81.
However, the Relative Strength Index (RSI) remains in bearish territory, almost flat, while the Rate of Change (RoC) shows buyers are beginning to gather impulse. Unless the RSI slope aims upward, traders might refrain from opening fresh long positions in the USD/JPY.
The USD/JPY key resistance levels are the 20-day EMA at 133.82, short of the 134.00 figure. A breach of the latter will expose the 200-day EMA at 134.81, followed by the 50-day EMA at 136.82. As an alternate scenario, the USD/JPY support levels would be the four-month-old downslope trendline turned support around 133.00, followed by the January 5 low of 131.68. Once cleared, the next support would be the YTD low of 129.50.
Technical Levels: Supports and Resistances
USDJPY currently trading at 133.42 at the time of writing. Pair opened at 132.68 and is trading with a change of 0.56 % .
| Overview | Overview.1 | |
|---|---|---|
| 0 | Today last price | 133.42 |
| 1 | Today Daily Change | 0.74 |
| 2 | Today Daily Change % | 0.56 |
| 3 | Today daily open | 132.68 |
The pair remains strongly bearish on the daily time frame. It trades below the 20 SMA @ 134.12, 50 SMA 138.58, 100 SMA @ 141.02 and 200 SMA @ 136.36.
| Trends | Trends.1 | |
|---|---|---|
| 0 | Daily SMA20 | 134.12 |
| 1 | Daily SMA50 | 138.58 |
| 2 | Daily SMA100 | 141.02 |
| 3 | Daily SMA200 | 136.36 |
The previous day high was 132.72 while the previous day low was 129.93. The daily 38.2% Fib levels comes at 131.65, expected to provide support. Similarly, the daily 61.8% fib level is at 130.99, expected to provide support.
Note the levels of interest below:
- Pivot support is noted at 130.83, 128.98, 128.04
- Pivot resistance is noted at 133.63, 134.57, 136.42
| Levels | Levels.1 |
|---|---|
| Previous Daily High | 132.72 |
| Previous Daily Low | 129.93 |
| Previous Weekly High | 134.50 |
| Previous Weekly Low | 130.78 |
| Previous Monthly High | 138.18 |
| Previous Monthly Low | 130.57 |
| Daily Fibonacci 38.2% | 131.65 |
| Daily Fibonacci 61.8% | 130.99 |
| Daily Pivot Point S1 | 130.83 |
| Daily Pivot Point S2 | 128.98 |
| Daily Pivot Point S3 | 128.04 |
| Daily Pivot Point R1 | 133.63 |
| Daily Pivot Point R2 | 134.57 |
| Daily Pivot Point R3 | 136.42 |
[/s2If]
Join Our Telegram Group
")


