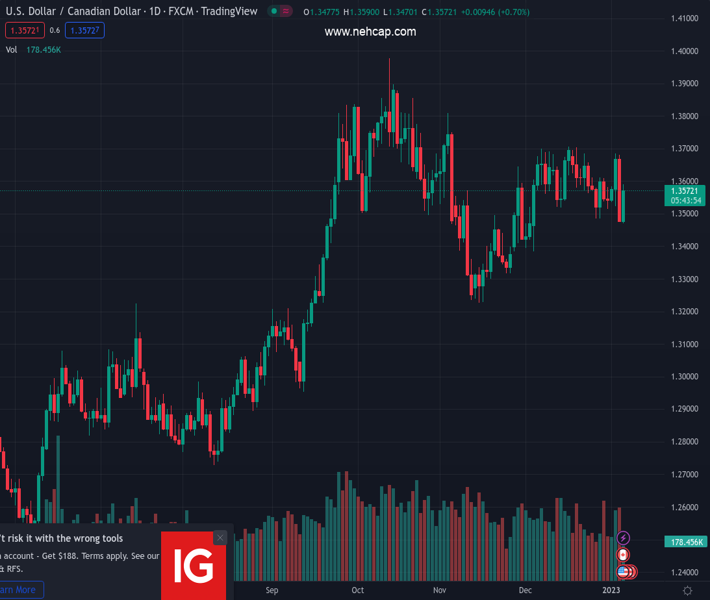
#USDCAD @ 1.35698 US Dollar rises sharply after data, DXY hits highest in almost a month. (Pivot Orderbook analysis)
…
This is a premium post.
[s2If !current_user_can(access_s2member_level4)]Please register for PREMIUM VERSION HERE to read full post below containing analysis. In case of any error or you think you are not able to read the full post below, please email us at support#nehcap.com [lwa][/s2If] [s2If current_user_can(access_s2member_level4)]
- US Dollar rises sharply after data, DXY hits highest in almost a month.
- USD/CAD rebounds from 1.3475 toward 1.3600.
- US and Canadian employment reports to be released on Friday.
The pair currently trades last at 1.35698.
The previous day high was 1.368 while the previous day low was 1.3476. The daily 38.2% Fib levels comes at 1.3554, expected to provide support. Similarly, the daily 61.8% fib level is at 1.3603, expected to provide resistance.
The USD/CAD is up on Thursday by more than a hundred pips booted by a stronger US Dollar. The pair peaked during the American session at 1.3587. It remains near the high with a firm bullish tone.
Despite falling versus the Dollar, the Loonie is outperforming on Thursday. AUD/CAD is at two-day lows while NZD/CAD dropped to the lowest since late November weakened by a deterioration in market sentiment. The Dow Jones is falling by 1.20% and the Nasdaq tumbles by 1.28%. Crude oil prices are up but off highs.
The USD/CAD could face resistance around the 1.3610/15 area and then 1.3650. The key level n the upside is seen at 1.3700. A daily close above would point to further strength. On the downside, the pair has rebounded from the relevant support of 1.3470/80; a daily close below should clear the way toward 1.3400.
Data released on Thursday showed an increase in private payrolls by 235K in December above the 150K of market consensus, according to ADP. The weekly jobless claims report showed a decline in initial claims to the 204K, the lowest since September. The December reading of the S&P Global Services PMI was revised to the upside from 44.4 to 44.7.
The US Dollar strengthened after the reports. The DXT surged to the highest level since December 8 above 105.00. US Treasury bond yields also climbed, reaching multi-day highs across the curve. The Nonfarm Payroll report is due on Friday. Market consensus is for an increase by 200K. The numbers could trigger more volatility.
In Canada employment report is also due on Friday. “We look for employment to rise by 8k in December as the Canadian labour market starts to cool. This should push the unemployment rate back to 5.2%, although we expect full-time employment to drive the headline print amid scarce labour supply. We also look for wages to push higher to 5.5% y/y with help from muted base effects, while hours worked should see a modest increase”, explained analysts at TD Securities.
Technical Levels: Supports and Resistances
USDCAD currently trading at 1.3573 at the time of writing. Pair opened at 1.3482 and is trading with a change of 0.67 % .
| Overview | Overview.1 | |
|---|---|---|
| 0 | Today last price | 1.3573 |
| 1 | Today Daily Change | 0.0091 |
| 2 | Today Daily Change % | 0.6700 |
| 3 | Today daily open | 1.3482 |
The pair is trading below its 20 Daily moving average @ 1.3598, above its 50 Daily moving average @ 1.3525 , above its 100 Daily moving average @ 1.3465 and above its 200 Daily moving average @ 1.3138
| Trends | Trends.1 | |
|---|---|---|
| 0 | Daily SMA20 | 1.3598 |
| 1 | Daily SMA50 | 1.3525 |
| 2 | Daily SMA100 | 1.3465 |
| 3 | Daily SMA200 | 1.3138 |
The previous day high was 1.368 while the previous day low was 1.3476. The daily 38.2% Fib levels comes at 1.3554, expected to provide support. Similarly, the daily 61.8% fib level is at 1.3603, expected to provide resistance.
Note the levels of interest below:
- Pivot support is noted at 1.3412, 1.3342, 1.3208
- Pivot resistance is noted at 1.3616, 1.375, 1.382
| Levels | Levels.1 |
|---|---|
| Previous Daily High | 1.3680 |
| Previous Daily Low | 1.3476 |
| Previous Weekly High | 1.3612 |
| Previous Weekly Low | 1.3484 |
| Previous Monthly High | 1.3705 |
| Previous Monthly Low | 1.3385 |
| Daily Fibonacci 38.2% | 1.3554 |
| Daily Fibonacci 61.8% | 1.3603 |
| Daily Pivot Point S1 | 1.3412 |
| Daily Pivot Point S2 | 1.3342 |
| Daily Pivot Point S3 | 1.3208 |
| Daily Pivot Point R1 | 1.3616 |
| Daily Pivot Point R2 | 1.3750 |
| Daily Pivot Point R3 | 1.3820 |
[/s2If]
Join Our Telegram Group
")


