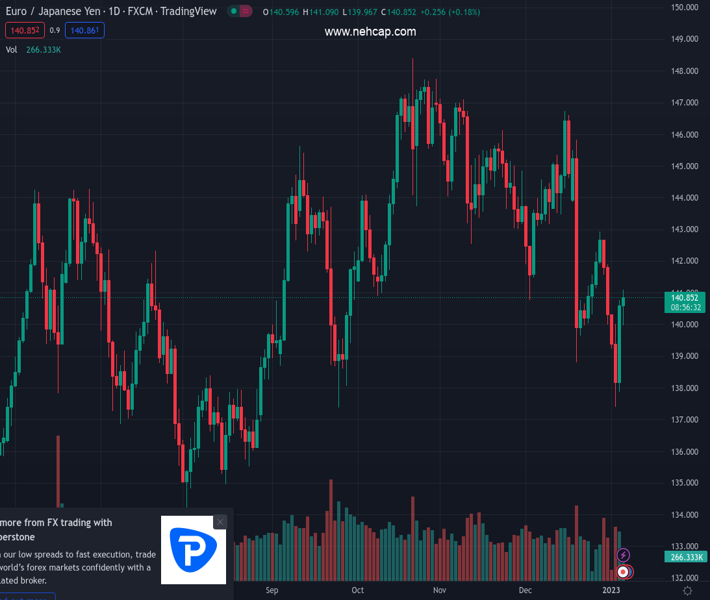
#EURJPY @ 140.761 adds to the weekly rebound and surpasses 140.00. (Pivot Orderbook analysis)
…
This is a premium post.
[s2If !current_user_can(access_s2member_level4)]Please register for PREMIUM VERSION HERE to read full post below containing analysis. In case of any error or you think you are not able to read the full post below, please email us at support#nehcap.com [lwa][/s2If] [s2If current_user_can(access_s2member_level4)]
- EUR/JPY adds to the weekly rebound and surpasses 140.00.
- Next on the upside comes the weekly high near 143.00.
The pair currently trades last at 140.761.
The previous day high was 140.76 while the previous day low was 137.88. The daily 38.2% Fib levels comes at 139.66, expected to provide support. Similarly, the daily 61.8% fib level is at 138.98, expected to provide support.
EUR/JPY adds to Wednesday’s gains and trespasses the key 140.00 barrier on Thursday.
The cross flirts with the critical 200-day SMA in the mid-140.00s. A sustainable move above the latter should shift the near-term outlook to positive and therefore open the door to extra gains.
Against that, the immediate barrier is then expected at the weekly peak at 142.93 (December 28). This resistance level is also underpinned by the proximity of the 100-day SMA (142.86).
Technical Levels: Supports and Resistances
EURJPY currently trading at 140.64 at the time of writing. Pair opened at 140.69 and is trading with a change of -0.04 % .
| Overview | Overview.1 | |
|---|---|---|
| 0 | Today last price | 140.64 |
| 1 | Today Daily Change | 113.00 |
| 2 | Today Daily Change % | -0.04 |
| 3 | Today daily open | 140.69 |
The pair is trading below its 20 Daily moving average @ 142.33, below its 50 Daily moving average @ 143.79 , below its 100 Daily moving average @ 142.86 and above its 200 Daily moving average @ 140.5
| Trends | Trends.1 | |
|---|---|---|
| 0 | Daily SMA20 | 142.33 |
| 1 | Daily SMA50 | 143.79 |
| 2 | Daily SMA100 | 142.86 |
| 3 | Daily SMA200 | 140.50 |
The previous day high was 140.76 while the previous day low was 137.88. The daily 38.2% Fib levels comes at 139.66, expected to provide support. Similarly, the daily 61.8% fib level is at 138.98, expected to provide support.
Note the levels of interest below:
- Pivot support is noted at 138.79, 136.89, 135.9
- Pivot resistance is noted at 141.68, 142.66, 144.56
| Levels | Levels.1 |
|---|---|
| Previous Daily High | 140.76 |
| Previous Daily Low | 137.88 |
| Previous Weekly High | 142.94 |
| Previous Weekly Low | 140.00 |
| Previous Monthly High | 146.73 |
| Previous Monthly Low | 138.80 |
| Daily Fibonacci 38.2% | 139.66 |
| Daily Fibonacci 61.8% | 138.98 |
| Daily Pivot Point S1 | 138.79 |
| Daily Pivot Point S2 | 136.89 |
| Daily Pivot Point S3 | 135.90 |
| Daily Pivot Point R1 | 141.68 |
| Daily Pivot Point R2 | 142.66 |
| Daily Pivot Point R3 | 144.56 |
[/s2If]
Join Our Telegram Group
")


