Asian stocks have rebounded as shrinkage in US manufacturing activities trims further policy tightening by the Fed. (Pivot Orderbook analysis)
…
This is a premium post.
[s2If !current_user_can(access_s2member_level4)]Please register for PREMIUM VERSION HERE to read full post below containing analysis. In case of any error or you think you are not able to read the full post below, please email us at support#nehcap.com [lwa][/s2If] [s2If current_user_can(access_s2member_level4)]
- Asian stocks have rebounded as shrinkage in US manufacturing activities trims further policy tightening by the Fed.
- Chinese equities have soared after the release of an upbeat Caixin Services PMI.
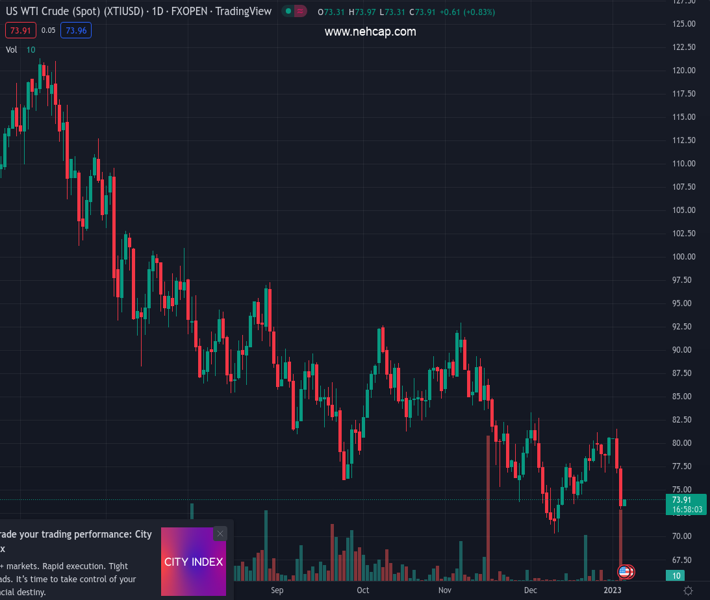
- Oil prices witnessed an immense sell-off amid escalating demand worries.
The pair currently trades last at 25877.95.
The previous day high was 25957.8 while the previous day low was 25638.72. The daily 38.2% Fib levels comes at 25835.91, expected to provide support. Similarly, the daily 61.8% fib level is at 25760.61, expected to provide support.
Markets in the Asian domain have witnessed decent demand tracing the recovery in S&P500, recorded on Wednesday. The United States equity domain witnessed strength after a consecutive drop in the US Manufacturing PMI. The economic data dropped to 48.4 vs. the consensus of 48.5 and the former release of 49.0. The Institute of Supply Management (ISM) cited that this is the lowest reading since May 2000.
At the press time, Japan’s Nikkei225 added 0.26%, ChinaA50 soared 2.07%, Hang Seng jumped 1.18%, and Nifty50 remained flat.
The volume of manufacturing activities in the United States has dropped consecutively for the second month led by aggressive interest rate policy by the Federal Reserve (Fed) for the entire CY2022. A spree of shrinkage in manufacturing activities has bolstered expectations of a further decline in inflation expectations. This might force Fed chair Jerome Powell to wrap up tight monetary policy quickly and resume providing monetary support to firms for addressing their investment and expansion plans.
Meanwhile, Chinese stocks have witnessed a sheer buying interest despite the Covid situation getting vulnerable each day. The release of upbeat Caixin Service PMI data has brought strength to equities. China’s Caixin Services PMI for December has arrived at 48.0 vs. 47.5 expected and 46.7 prior, showing that the country’s services activity slowed its pace of contraction in the reported month.
Nikkei225 remained marginally positive as the Bank of Japan (BoJ) is aiming to revise its inflation targets in its new quarterly projections for CY2023 and 2024, as reported by Reuters.
On the oil front, oil prices witnessed a bloodbath on Wednesday as a decline in US manufacturing activities has bolstered the risk of recession. West Texas futures dropped below $73.00 as rising Covid infections in China are signaling a delayed recovery.
Technical Levels: Supports and Resistances
XTIUSD currently trading at 25877.95 at the time of writing. Pair opened at 25877.95 and is trading with a change of 0.0 % .
| Overview | Overview.1 | |
|---|---|---|
| 0 | Today last price | 25877.95 |
| 1 | Today Daily Change | 0.00 |
| 2 | Today Daily Change % | 0.00 |
| 3 | Today daily open | 25877.95 |
The pair remains strongly bearish on the daily time frame. It trades below the 20 SMA @ 26787.46, 50 SMA 27427.16, 100 SMA @ 27447.3 and 200 SMA @ 27272.79.
| Trends | Trends.1 | |
|---|---|---|
| 0 | Daily SMA20 | 26787.46 |
| 1 | Daily SMA50 | 27427.16 |
| 2 | Daily SMA100 | 27447.30 |
| 3 | Daily SMA200 | 27272.79 |
The previous day high was 25957.8 while the previous day low was 25638.72. The daily 38.2% Fib levels comes at 25835.91, expected to provide support. Similarly, the daily 61.8% fib level is at 25760.61, expected to provide support.
Note the levels of interest below:
- Pivot support is noted at 25691.85, 25505.74, 25372.77
- Pivot resistance is noted at 26010.93, 26143.9, 26330.01
| Levels | Levels.1 |
|---|---|
| Previous Daily High | 25957.80 |
| Previous Daily Low | 25638.72 |
| Previous Weekly High | 26479.57 |
| Previous Weekly Low | 25793.22 |
| Previous Monthly High | 28325.89 |
| Previous Monthly Low | 25793.22 |
| Daily Fibonacci 38.2% | 25835.91 |
| Daily Fibonacci 61.8% | 25760.61 |
| Daily Pivot Point S1 | 25691.85 |
| Daily Pivot Point S2 | 25505.74 |
| Daily Pivot Point S3 | 25372.77 |
| Daily Pivot Point R1 | 26010.93 |
| Daily Pivot Point R2 | 26143.90 |
| Daily Pivot Point R3 | 26330.01 |
[/s2If]
Join Our Telegram Group
")


